If you’ve ever tried to keep a close eye on your SSD or HDD health inside Home Assistant, you probably discovered that the ecosystem offers surprisingly few clean, reliable ways to surface SMART data. Many people turn to the popular Scrutiny Docker container—which is great on paper, until you realize it’s yet another container to maintain, another UI to check, and not exactly lightweight. And if you just want SMART metrics directly inside your Home Assistant dashboard, Scrutiny can quickly feel like overkill.
That’s where go-hass-agent steps in.
Originally created as a simple system monitor and Home Assistant companion for desktop machines and servers, go-hass-agent has quietly become one of the most efficient ways to feed local hardware metrics—including SMART status—straight into Home Assistant. No extra dashboards, no heavy containers, no polling bridges. Just clean, native sensors that behave like any other entity in your system.
In this guide, I’ll show you how to add full SMART monitoring for SSDs and HDDs to your Home Assistant dashboard using go-hass-agent. We’ll also look at why, for many setups, this approach is actually better than running a Scrutiny Docker stack—especially if you care about speed, simplicity, and seamless integration across all your devices.
Let’s dive in.
Install go-hass-agent
While the official companion.home-assistant.io site focuses on mobile apps, the desktop and server-side agents—like HASS-AGENT—live in separate GitHub repositories.
In my setup, I’m running Home Assistant in Docker on a Raspberry Pi, so I’ll walk you through how to install GO-HASS-AGENT on a headless Linux machine.
Start by visiting the GO-HASS-AGENT GitHub repository and downloading the package that matches both your hardware architecture and Linux distribution.
For my Raspberry Pi (ARM64), the correct package is: go-hass-agent_14.2.0_arm64.deb
Let’s download and install the package:
 wget https://github.com/joshuar/go-hass-agent/releases/download/v14.2.0/go-hass-agent_14.2.0_arm64.deb
 sudo dpkg -i go-hass-agent_14.2.0_arm64.deb
⚠️ Don’t forget to adjust commands according to your system and actual package version.
Add go-hass-agent to Home Assistant
To allow go-hass-agent to register with your Home Assistant instance, you’ll need a Long-Lived Access Token. Let’s create one:
- Open your Home Assistant web interface and go to Settings → People, then switch to the Users tab. Click + Add user.
- Create a regular user (no Administrator permissions required).
- Open a new incognito/private browser window and log in using the new user’s credentials.
- Click the username in the lower-left corner of the Home Assistant sidebar, go to the Security tab, scroll down, and click Create token.
- Copy and save the token—you’ll need it in the next step.
- Run the following command in your termal:
go-hass-agent register --token 'YOUR_TOKEN' --server http://HA_url:port/
systemctl --user enable go-hass-agent
systemctl --user start go-hass-agent
⚠️ go-hass-agent must be run without root privileges, so don’t use sudo to start it.
Check if go-hass-agent is started:
systemctl --user status go-hass-agentYou should see an output like this:
go-hass-agent.service
     Loaded: loaded (/usr/lib/systemd/user/go-hass-agent.service; enabled; preset: enabled)
     Active: active (running) since Tue 2025-12-09 13:40:14 CET; 3 days ago
 Invocation: 13b9e2d35a2945a8a758d4224b18fc4e
   Main PID: 845996 (go-hass-agent)
      Tasks: 14 (limit: 8763)
     Memory: 27M (peak: 48.5M, swap: 10.3M, swap peak: 10.3M)
        CPU: 59min 57.804s
     CGroup: /user.slice/user-1000.slice/user@1000.service/app.slice/go-hass-agent.service
             ├─845996 /usr/bin/go-hass-agent run
             └─846007 pw-dump --monitor --no-colors
Now let’s verify that go-hass-agent was successfully added to Home Assistant:
Open your Home Assistant web interface and navigate to Settings → Devices & Services.
Switch to the Devices tab and look for a new device named after your Linux machine’s hostname, with the integration type listed as Mobile App.
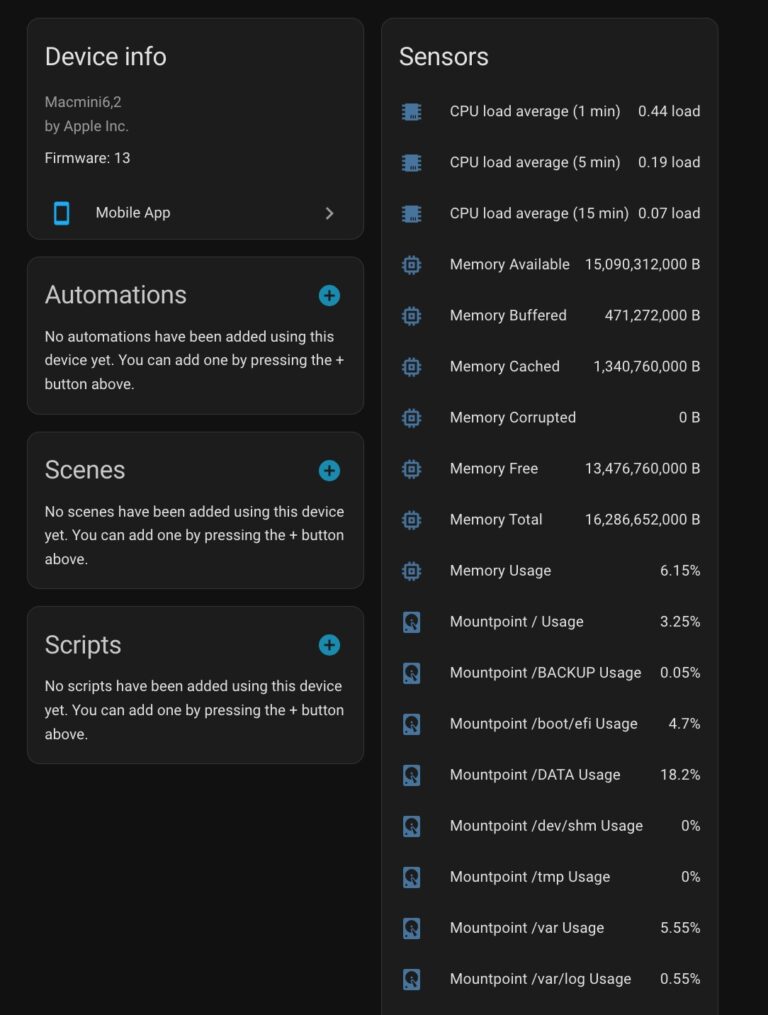
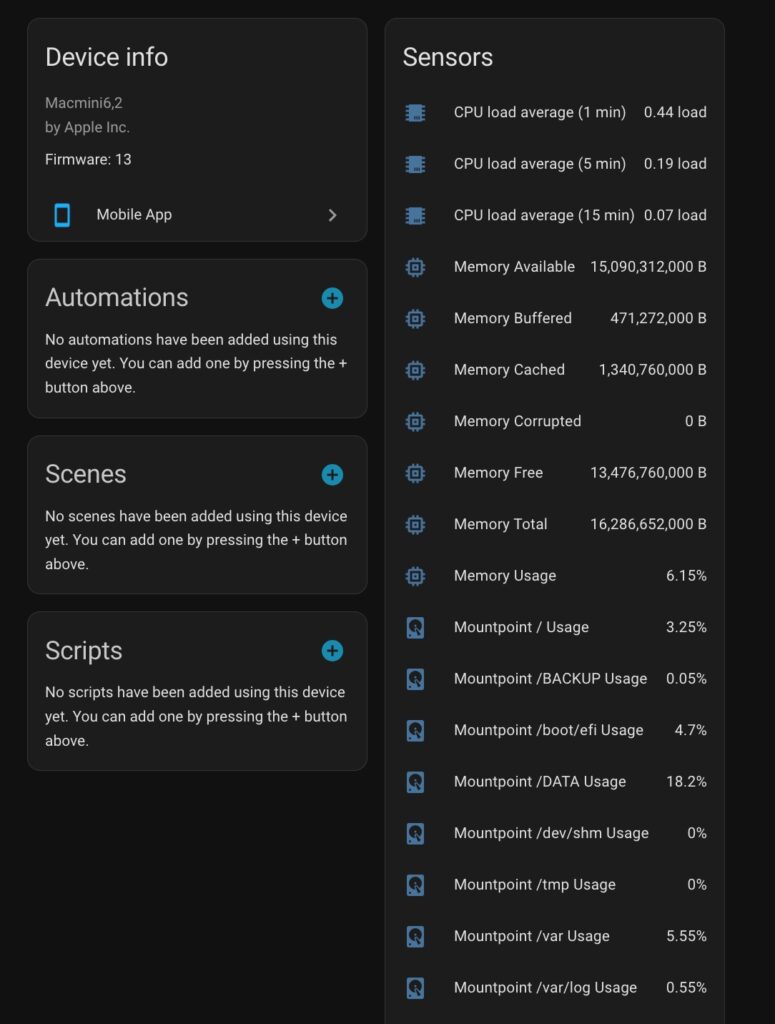
Click on the device to open it and review the newly added entities.
If everything is set up correctly, you should see multiple system-related sensors ready to use in your dashboards and automations:
Check if you have SMART Status entities for your SDD/HDD e.g. “Sda SMART Status”.
⚠️ I run several Linux machines in my home setup, and the results were mixed:
Mac mini running Debian: SMART status is available
AMD gaming PC with Kubuntu: SMART status is available
Raspberry Pi running Raspberry Pi OS with Home Assistant: SMART status is not added by go-hass-agent
As a workaround, I created an additional script to expose SMART status to Home Assistant.
If you’re running into the same limitation on Raspberry Pi or similar setups, you’ll find the script and setup instructions later in this article.
Add sensors with Additional details for SMART statuses
By default, you would have the following two statuses:
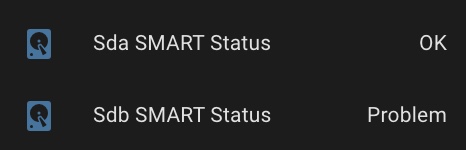
However, go-hass-agent exposes rich SSD/HDD SMART data as attributes of the existing disk entities, including detailed health metrics that aren’t shown by default. To make this information visible on your dashboard, we’ll create additional entities using Home Assistant helpers, allowing us to better understand the level of disk degradation at a glance.
First, let’s take a look at the available SMART attributes:
Open Developer Tools in Home Assistant.
Switch to the States tab.
Type SMART into the Filter entities field to locate the SMART-related entities for your disks.
From here, you can inspect each entity’s attributes and identify which values you want to expose as separate sensors on your dashboard.
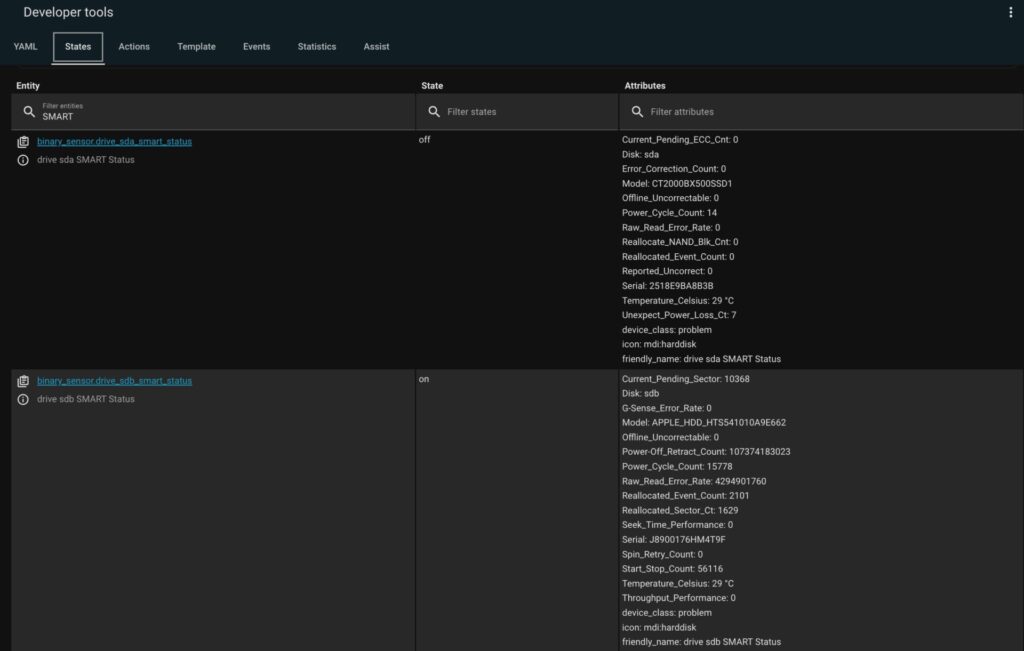
For me, the most important SMART attributes are:
Temperature_Celsius — helps identify overheating or cooling issues
Current_Pending_ECC_Cnt — indicates SSD degradation
Current_Pending_Sector — highlights HDD degradation
⚠️ For illustration purposes, I connected a very old disk to my PC to demonstrate how go-hass-agent reports drive health issues.
Disk Temperature sensor
Now let’s create the helpers that will expose SMART Temperature as standalone sensor:
Go to Settings → Devices & Services.
Switch to the Helpers tab and click + Create helper.
In the dialog that opens, select Template as the helper type.
Choose Sensor as the entity type.
Fill in the fields as follows:
Name: for example, Drive Disk SDA Temperature
State:
{{ state_attr('binary_sensor.drive_sda_smart_status', 'Temperature_Celsius')
   | replace(' °C', '')
   | float }}
Unit of measurement:
°CDevice class:
Temperature- State class:
Measurement
⚠️ Note:
Replace binary_sensor.drive_sda_smart_status with the name of your own SMART entity, and Temperature_Celsius with the exact attribute name you found earlier in Developer Tools → States.
Finally, click Submit to create the helper.
Once saved, this new sensor can be added directly to your Home Assistant dashboard, giving you clear visibility into your drive’s temperature .
Disk Degradation sensor
Now let’s create the helpers that will expose SMART Degradation as standalone sensor:
Go to Settings → Devices & Services.
Switch to the Helpers tab and click + Create helper.
In the dialog that opens, select Template as the helper type.
Choose Sensor as the entity type.
Fill in the fields as follows:
Name: for example, Drive Disk SDA Bad Sectors
State: Choose one of the following:
- For SSD:
{{ state_attr('binary_sensor.drive_sda_smart_status', 'Current_Pending_ECC_Cnt') | int}}- For HDD:
{{ state_attr('binary_sensor.drive_sdb_smart_status', 'Current_Pending_Sector') | int}}Unit of measurement:
EmptyDevice class:
Empty- State class:
Measurement
⚠️ Note:
Replace binary_sensor.drive_sda_smart_status with the name of your own SMART entity, and Temperature_Celsius with the exact attribute name you found earlier in Developer Tools → States.
Finally, click Submit to create the helper.
Once saved, this new sensor can be added directly to your Home Assistant dashboard, giving you clear visibility into your drive’s degradation .
Now you can create automations to notify yourself if some parameters exceed critical values.
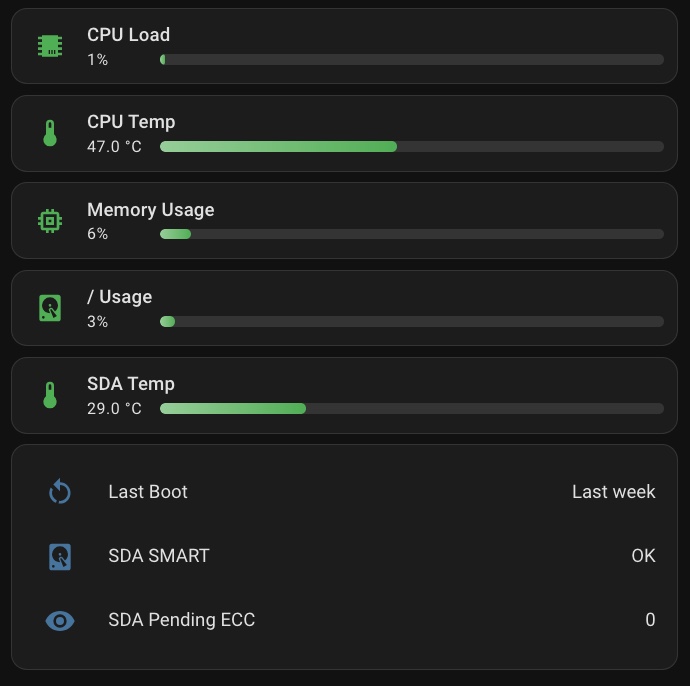
Create a Card with a Disk Statuses on a Dashboard
At this point, you have everything you need to build a custom card on your Home Assistant dashboard.
As a simple example, I created a card that displays sensors for one mount point and one disk. You can easily extend this approach by adding more sensors for additional disks, mount points, or SMART attributes as needed.
The entity progress card is used for this example. So, you have to install it in your Home Assistant if you want to follow the example.
Now let’s add a card to display your disk SMART information:
Navigate to the Home Assistant dashboard where you want to show your disk health data.
Click Add card.
Select Manual as the card type.
In the card editor, replace the default
type: ""content with the YAML code shown below.Carefully replace each entity name in the configuration with the actual entities from your setup.
type: vertical-stack
cards:
  - type: custom:entity-progress-card
    bar_size: small
    bar_effect:
      - radius
      - gradient
    custom_theme:
      - min: 0
        max: 40
        color: green
      - min: 40
        max: 60
        color: amber
      - min: 60
        max: 100
        color: red
    entity: sensor.drive_total_cpu_usage
    name: CPU Load
  - type: custom:entity-progress-card
    bar_size: small
    bar_effect:
      - radius
      - gradient
    custom_theme:
      - min: 0
        max: 60
        color: green
      - min: 60
        max: 80
        color: amber
      - min: 80
        max: 100
        color: red
    entity: sensor.drive_hardware_sensor_coretemp_core_0
    name: CPU Temp
  - type: custom:entity-progress-card
    bar_size: small
    bar_effect:
      - radius
      - gradient
    custom_theme:
      - min: 0
        max: 40
        color: green
      - min: 40
        max: 60
        color: amber
      - min: 60
        max: 100
        color: red
    entity: sensor.drive_memory_usage
    name: Memory Usage
  - type: custom:entity-progress-card
    bar_size: small
    bar_effect:
      - radius
      - gradient
    custom_theme:
      - min: 0
        max: 50
        color: green
      - min: 50
        max: 80
        color: amber
      - min: 80
        max: 100
        color: red
    entity: sensor.drive_mountpoint_usage
    name: / Usage
  - type: custom:entity-progress-card
    bar_size: small
    bar_effect:
      - radius
      - gradient
    custom_theme:
      - min: 0
        max: 60
        color: green
      - min: 60
        max: 80
        color: amber
      - min: 80
        max: 100
        color: red
    name: SDA Temp
    entity: sensor.drive_disk_sda_temperature
  - type: entities
    entities:
      - entity: sensor.drive_last_reboot
        name: Last Boot
      - entity: binary_sensor.drive_sda_smart_status
        name: SDA SMART
      - entity: sensor.drive_disk_sda_pending_ecc
        name: SDA Pending ECC
Create SMART Disk Sensors for Raspberry PI
Idea of WorkAround
While go-hass-agent exposes a wealth of system details on Raspberry Pi, it does not currently provide SMART information. As a result, an additional workaround is required.
My solution consists of three parts:
A Bash script that gathers the required SMART data and writes it to a JSON file
A Home Assistant command-line sensor that reads this file and exposes the data as a sensor
⚠️ Note: I initially tried to use a File Sensor configured through the Home Assistant UI and parse the JSON directly there to simplify the setup. However, despite multiple attempts, the sensor only ever returned a single}character. After spending too much time troubleshooting, I abandoned this approach and switched to a command-line sensor instead.Helpers that convert the command-line sensor’s attributes into individual entities suitable for dashboards and automations
This approach keeps the setup flexible while ensuring that SMART data is reliably available inside Home Assistant—even on Raspberry Pi systems where go-hass-agent falls short.
BASH Script that gathers the required SMART data and writes it to a JSON file
sudo apt update
sudo apt install smartmontools -y
sudo apt install jq -ytouch /opt/smart.sh
chmod +x /opt/smart.shmcedit /opt/smart.sh #!/bin/bash
# --- CONFIGURATION ---
# Output file location on the host (where Home Assistant is mounted to /config)
OUTPUT="/opt/HA/homeassistant/smart_status.json"
DISKS="/dev/sda /dev/sdb"
# Create a temporary file for atomic write
TMP=$(mktemp)
echo "{" > "$TMP"
first=1
for disk in $DISKS; do
# Prepend comma if not the first disk
[ "$first" -eq 0 ] && echo "," >> "$TMP"
first=0
key=$(basename "$disk" | sed 's/n1$//')
# --- 1. SET GUARANTEED DEFAULT JSON VALUES ---
# These are set for every disk. If smartctl fails, these valid JSON primitives are used.
model="Unknown"
serial="Unknown"
health="false" # Boolean written as string literal
temp="null" # JSON null literal
poh="null" # JSON null literal
bad="0" # JSON number literal
pending="0" # JSON number literal
wear="null" # JSON null literal
# --- Check if disk is even present ---
if [ ! -b "$disk" ]; then
cat <<EOT >> "$TMP"
"$key": {
"last_updated": "$(date -Iminutes)",
"health": false,
"model": "Not present",
"serial": "",
"temperature": null,
"power_on_hours": null,
"bad_blocks": 0,
"pending_sectors": 0,
"wear_level": null
}
EOT
continue
fi
# --- 2. TRY TO GET SMART DATA ---
data=""
for type in "" "-d nvme" "-d ata" "-d sat" "-d usbjmicron" "-d usbcypress" "-d sat,auto"; do
# 12-second timeout per attempt
data=$(timeout 12 /usr/sbin/smartctl --json=c -a $type "$disk" 2>/dev/null || true)
# If we got a model name, the command succeeded.
if echo "$data" | /usr/bin/jq -e '.model_name' >/dev/null 2>&1; then
break
fi
data="" # Clear if check fails
done
# --- 3. PROCESS DATA IF AVAILABLE ---
if [ -n "$data" ]; then
# Overwrite defaults with actual values
model=$(echo "$data" | /usr/bin/jq -r '.model_name // "Unknown"')
serial=$(echo "$data" | /usr/bin/jq -r '.serial_number // "Unknown"')
health=$(echo "$data" | /usr/bin/jq -r '.smart_status.passed // false')
temp=$(echo "$data" | /usr/bin/jq -r '
.temperature.current //
.temperature_celsius.current //
.nvme_smart_health_information_log.temperature //
null
')
poh=$(echo "$data" | /usr/bin/jq -r '
.power_on_time.hours //
.nvme_smart_health_information_log.power_on_hours //
null
')
bad=$(echo "$data" | /usr/bin/jq -r '
(.ata_smart_attributes.table // []) |
map(select(.name == "Reallocated_Sector_Ct")) |
.[0].raw.value // 0
')
pending=$(echo "$data" | /usr/bin/jq -r '
(.ata_smart_attributes.table // []) |
map(select(.name == "Current_Pending_Sector")) |
.[0].raw.value // 0
')
wear=$(echo "$data" | /usr/bin/jq -r '.nvme_smart_health_information_log.percentage_used // null')
fi
# --- 4. WRITE FINAL JSON BLOCK ---
cat <<EOT >> "$TMP"
"$key": {
"last_updated": "$(date -Iminutes)",
"health": $health,
"model": $(printf '%s' "$model" | jq -R .),
"serial": $(printf '%s' "$serial" | jq -R .),
"temperature": $temp,
"power_on_hours": $poh,
"bad_blocks": $bad,
"pending_sectors": $pending,
"wear_level": $wear
}
EOT
done
# --- ATOMIC RENAME AND CLEANUP ---
# Close the JSON object
echo -e "\n}" >> "$TMP"
# Ensure the output directory exists
mkdir -p "$(dirname "$OUTPUT")"
# Atomically replace the old file with the new temporary file
mv "$TMP" "$OUTPUT"
# Set permissions for easy reading by the HA container
chmod 644 "$OUTPUT"
healthy=$(jq 'to_entries | map(select(.value.health == true)) | length' "$OUTPUT")
total=$(jq 'keys | length' "$OUTPUT")
echo "smart_status.json updated — $healthy/$total disks healthy → $OUTPUT"⚠️ Note: Adjust the following variables:
- OUTPUT=“/opt/HA/homeassistant/smart_status.json”
The path must correspond to the folder that your Home Assistant sees as “/config/“, e.g.
mounted to your docker container with HA as:
volumes:– /opt/HA/homeassistant:/config
- DISKS=“/dev/sda /dev/sdb”
The list of your disks.
Save and run the script.
As a result, you must see an output in your “/HA_path/”smart_status.json file like the following:
{
  "sda": {
    "last_updated": "2025-12-13T10:45+01:00",
    "health": true,
    "model": "WDC WD20SPZX-00UA7T0",
    "serial": "WD-WXU2E61DR3W0",
    "temperature": 47,
    "power_on_hours": 32180,
    "bad_blocks": 0,
    "pending_sectors": 0,
    "wear_level": null
  }
,
  "sdb": {
    "last_updated": "2025-12-13T10:45+01:00",
    "health": true,
    "model": "WDC WD10JMVW-11AJGS3",
    "serial": "WD-WX61EC3CNFP7",
    "temperature": 37,
    "power_on_hours": 34921,
    "bad_blocks": 0,
    "pending_sectors": 0,
    "wear_level": null
  }

}
Now, let’s configure cron for running this script periodically, e.g. each 15 minutes:
sudo touch /etc/cron.d/smart_state
sudo chmod 644 /etc/cron.d/smart_state
sudo  ls -la /etc/cron.d/smart_state
-rw-r--r-- 1 root root 32 Dec 13 11:02 /etc/cron.d/smart_state
Add the following config in your new cron file:
*/15 * * * * root /opt/smart.sh
⚠️ Note: You MUST add an empty row in yout cron file, otherwise cron will ignore that config.
Restart your cron to apply the added config:
sudo systemctl restart cron
sudo systemctl restart cron
Home Assistant Command Line Sensor
The next step is getting your stored disk (s) statuses into Home Assistant.
Open your /config/configuration.yaml file in the editor and add the following section:
command_line:
 - sensor:
     name: smart_disks_data
     # Use the reliable 'cat' command to read the file content
     command: "cat /config/smart_status.json"
     scan_interval: 900
     # Tell HA to extract 'sda' and 'sdb' as attributes from the raw command output
     json_attributes:
      - sda
      - sdb
     # Set the sensor's main state to a simple, useful value (healthy disk count)
     value_template: >
       {# The 'value' variable here holds the full raw JSON string from the command output #}
       {% set data = value | from_json(default={}) %}
       {# Calculate the count of healthy disks for the main sensor state #}
       {% set total_disks = data | list | count %}
       {% set healthy_disks = data | selectattr('health', 'equalto', true) | list | count %}
       {% if total_disks > 0 %}
         {{ healthy_disks }}
       {% else %}
         0
       {% endif %}
⚠️ Note: Adjust the following parameters:
- scan_interval: 900 – how often to read the file in seconds
- json_attributes: – list of your disks must correspond to the list in the bash script.
Now you must restart your Home Assistant if you didn’t have command_line sensors before, otherwise, go to Developer Tool -> YAML -> YAML configuration reloading, and click on “Command line entities”.
After reloading, go to Developer Tool -> States, and find your smart_disks_data sensor.
You should see a state like this:
sda:
last_updated: 2025-12-13T11:00+01:00
health: true
model: WDC WD20SPZX-00UA7T0
serial: WD-WXU2E61DR3W0
temperature: 47
power_on_hours: 32181
bad_blocks: 0
pending_sectors: 0
wear_level: null

sdb:
last_updated: 2025-12-13T11:00+01:00
health: true
model: WDC WD10JMVW-11AJGS3
serial: WD-WX61EC3CNFP7
temperature: 37
power_on_hours: 34922
bad_blocks: 0
pending_sectors: 0
wear_level: null

friendly_name: smart_disks_data
Helpers that convert the command-line sensor’s attributes into individual entities
Please follow the steps in “Add sensors with Additional details for SMART statuses” chapter of this article to create helpers using the following parameters:
Temperature Sensor
Please follow the steps in “Add sensors with Additional details for SMART statuses” chapter of this article to create helpers using the following parameters:
Name: for example, Disk SDA Temperature
State:
{{ state_attr('sensor.smart_disks_data', 'sda')['temperature'] | default(0) }}Unit of measurement: °C
Device class: Temperature
- State class:
Measurement
⚠️ Note: Replace 'sda' with the name of your own disk name.
Click Submit to create the helper.
Bad Blocks Sensor
Please follow the steps in “Add sensors with Additional details for SMART statuses” chapter of this article to create helpers using the following parameters:
Name: for example, Disk SDA Bad Blocks
State:
{{ state_attr('sensor.smart_disks_data', 'sda')['bad_blocks'] | default(0) }}Unit of measurement:
EmptyDevice class:
Empty
⚠️ Note: Replace 'sda' with the name of your own disk name.
Click Submit to create the helper.
Disk Health Status Sensor
Please follow the steps in “Add sensors with Additional details for SMART statuses” chapter of this article to create helpers using the following parameters:
Name: for example, Disk SDA Health
State:
{{ state_attr('sensor.smart_disks_data', 'sda')['health']}}Unit of measurement:
EmptyDevice class:
Empty- State class:
Empty
⚠️ Note: Replace 'sda' with the name of your own disk name.
Click Submit to create the helper.
Disks Last Update
This parameter is used to verify that the Bash script is running successfully. An outdated timestamp indicates that the script is NOT executed within the configured interval.
Please follow the steps in “Add sensors with Additional details for SMART statuses” chapter of this article to create helpers using the following parameters:
Name: for example, Disks Last Update
State:
{{ state_attr('sensor.smart_disks_data', 'sda')['last_updated']}}Unit of measurement:
EmptyDevice class: Timestamp
- State class:
Empty
⚠️ Note: Replace 'sda' with the name of your own disk name.
Click Submit to create the helper.
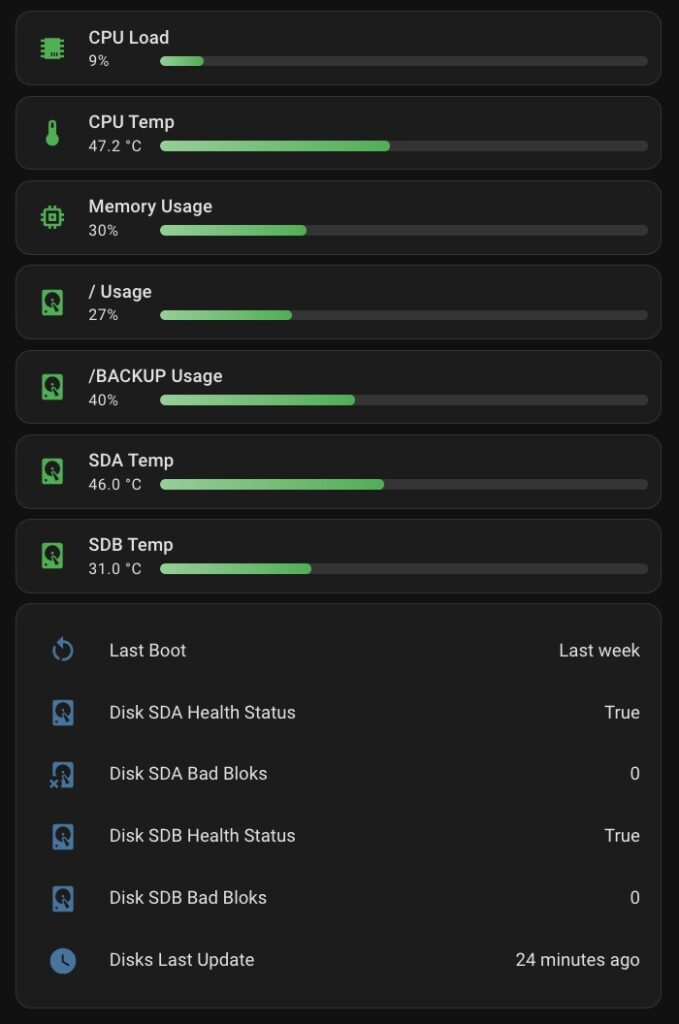
Finally, follow the steps described in “Create a Card with a Disk Statuses on a Dashboard” chapter to create a dashboard card like this: