While the native Home Assistant System Monitor is excellent for basic oversight, integrating Beszel—a lightweight hub-and-node monitoring solution—elevates infrastructure management to a professional level. Here is how it compares to standard tools and the popular go-hass-agent (please see my article about its integration with HA):
1. Multi-Node Centralization & Docker Awareness
The standard HA integration monitors only the local host. Beszel uses a “hub and agent” model to unify all your servers in one view. Unlike native sensors, it provides deep Docker awareness, allowing you to see which specific container is spiking the CPU or leaking memory.
2. Proactive Disk Health (S.M.A.R.T.)
While standard integrations usually only report “Disk Usage %,” Beszel can monitor S.M.A.R.T. statistics. It tracks temperature, power-on hours, and critical failure indicators (like reallocated sectors). This allows Home Assistant to alert you before a drive fails, rather than just telling you it’s full.
3. Historical Trends vs. Database Bloat
Native HA sensors can bloat your database tracking high-frequency metrics. Beszel is optimized for time-series data, providing high-resolution charts without taxing the Home Assistant recorder.
Beszel vs. go-hass-agent:
| Feature | Beszel | go-hass-agent |
| Primary Focus | Server/Homelab Infrastructure | Desktop/Laptop Integration |
| Visuals | Built-in, high-performance charts | Depends on HA Lovelace cards |
| Storage Health | Integrated S.M.A.R.T. support | Integrated S.M.A.R.T. support, But doesn’t work on Raspberry PI at least |
| Containerization | Per-container resource metrics | Basic host-level metrics |
| System Control | Monitoring only (Read-only) | Can trigger commands (Sleep/Lock) |
The Verdict: Choose go-hass-agent for desktop control (like volume or sleep); choose Beszel for reliable server monitoring and proactive disk health tracking across your entire homelab.
After publishing the article about go-hass-agent I got questions “why not Glances”, so please see the following comparison if you are concerned:
Both Beszel and Glances are powerful tools for monitoring system resources, but they serve very different philosophies in the Home Assistant ecosystem. Glances is a classic, feature-rich “everything-and-the-kitchen-sink” monitor, while Beszel is a modern, distributed visualization suite.
1. Architecture and Scaling
Glances: Primarily a standalone tool. To monitor multiple servers in Home Assistant, you typically have to run an instance on each machine and add them as separate integrations. It can be resource-heavy because it gathers hundreds of data points simultaneously.
Beszel: Built specifically for a hub-and-node setup. You run one “Hub” (which connects to Home Assistant) and tiny “Agents” on all your other systems. It is significantly lighter on the CPU and RAM of the monitored nodes.
2. Data Visualization & History
Glances: Excellent for real-time “what is happening right now” snapshots. While it can export to databases, the native Home Assistant integration mostly provides current sensor states.
Beszel: Built with time-series charts at its core. It provides beautiful, smooth historical graphs for CPU, RAM, and Network right out of the box, whereas Glances requires you to build your own graphs in Lovelace using the raw sensor data.
3. Docker and S.M.A.R.T. Depth
Glances: Provides a massive list of processes and basic Docker stats. It is great for seeing “which process is lagging my PC.”
Beszel: Offers superior Docker awareness, grouping resources by container name automatically. Crucially, it has built-in S.M.A.R.T. monitoring for disk health, which is often easier to configure than the complex Python dependencies sometimes required for Glances to see hardware sensors.
| Feature | Beszel | Glances |
| Philosophy | Clean, distributed visualization | Comprehensive “Top” replacement |
| Setup Complexity | Very Low (Docker-first) | Medium (Python or Docker) |
| Multi-Server | Native (Single Dashboard) | Requires multiple HA integrations |
| Resource Usage | Ultra-lightweight agent | Moderate to High |
| Historical Data | Built-in high-res charts | Raw sensors only (requires InfluxDB/Grafana for charts) |
| Actionable Alerts | Focus on health/trends | Focus on thresholds/processes |
The Verdict: Use Glances if you need to monitor a single powerful machine and want to see every single process, fan speed, and IP connection in real-time.
Use Beszel if you have a homelab with multiple servers/VMs and want a beautiful, low-overhead way to track long-term health, disk S.M.A.R.T. status, and Docker performance within Home Assistant.
Adding Beszel Docker into Home Assistant docker setup ecosystem
I have my entire Home Assistant Docker ecosystem in the /opt/HA folder, so I use that path, but feel free to change it according to your preferences.
Let’s start with the creation of the necessary folders for Beszel Hub and Beszel Agent:
sudo mkdir -p /opt/HA/beszel/beszel_agent_data
sudo mkdir -p /opt/HA/beszel/beszel_data
Beszel Hub Setup
The next step is adding Beszel hub container to your HA Docker setup.
Open your docker-compose file and add the config for Beszel:
  beszel:
    image: henrygd/beszel:latest
    container_name: beszel-hub
    restart: unless-stopped
    ports:
      - "8090:8090"
    volumes:
      - /opt/beszel/beszel_data:/beszel_data
    hostname: beszel
    networks:
     home_assistant:
       aliases:
         - beszel
       ipv4_address: 172.20.0.7


  home_assistant:
    container_name: ha
    image: "ghcr.io/home-assistant/home-assistant:stable"
    restart: unless-stopped
    hostname: ha
    depends_on:
      - zigbee2mqtt
    volumes:
      - /opt/HA/homeassistant:/config
      - /etc/localtime:/etc/localtime:ro
      - /run/dbus:/run/dbus:ro
    privileged: true
    network_mode: host
    extra_hosts:
      - "zigbee2mqtt:172.20.0.2"
      - "core-mosquitto:172.20.0.3"
      - "hass-configurator:172.20.0.4"
      - "portainer:172.20.0.5"
      - "sunsynk:172.20.0.6"
      - "beszel:172.20.0.7"


networks:
  home_assistant:
    driver: bridge
    name: home_assistant
    ipam:
      config:
        - subnet: 172.20.0.0/16
Sure, you could take the easy route by setting network_mode: host and letting your containers share the host’s network. It definitely saves time since you don’t have to worry about configuring internal networks or aliases.
However, I usually recommend keeping containers isolated in their own bridge network. Here’s why I think it’s worth the extra couple of lines of config:
- Better Security: Even on a home server, it’s a good habit to follow the principle of least privilege. If one container is compromised, isolation helps keep the rest of your system safe.
- Cleaner Traffic: It keeps container-specific ‘chatter’ and broadcast traffic off your main home network, which helps prevent unnecessary congestion.
Now start your Beszel container:
sudo docker compose up -d --remove-orphansBeszel Agent Setup
“With everything up and running, head over to your Beszel web interface at http://YOUR_HA_IP:8090 to create your admin account. Once you’re logged in, adding your first system is a breeze:
Start the setup: Click the + Add System button in the top-right corner of the UI.
Identify the instance: Give it a name like ‘Home Assistant’ so you can easily find it later.
Set the IP: Fill in the Host/IP field with your Home Assistant IP (this is mainly for your own reference).
Grab the config: Click Copy Docker Compose to get the configuration you’ll need for the agent.
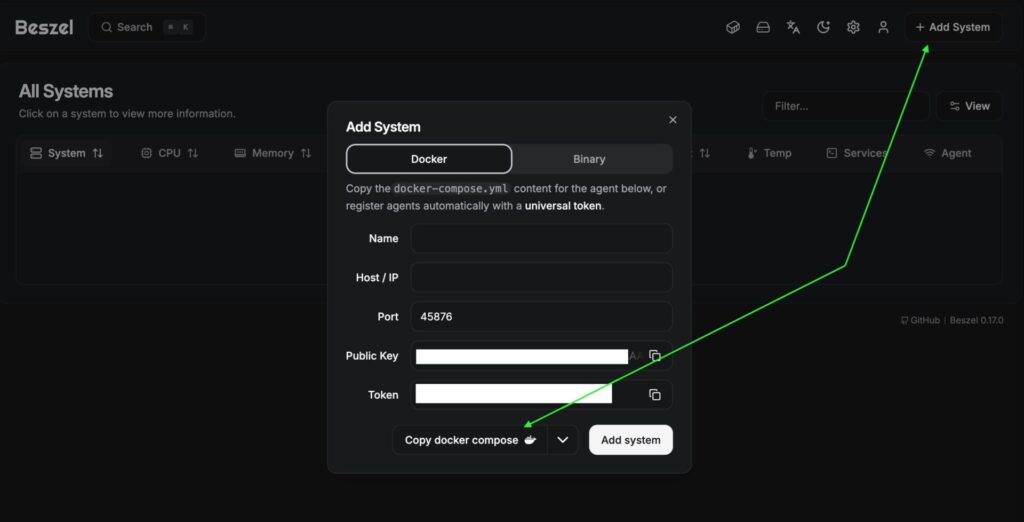
Your copied Docker Compose configuration should look like this. Notice that it includes the KEY specific to your instance, which is what allows the agent to talk to your hub securely:
services:
  beszel-agent:
    image: henrygd/beszel-agent
    container_name: beszel-agent
    restart: unless-stopped
    network_mode: host
    volumes:
      - /var/run/docker.sock:/var/run/docker.sock:ro
      - ./beszel_agent_data:/var/lib/beszel-agent
      # monitor other disks / partitions by mounting a folder in /extra-filesystems
      # - /mnt/disk/.beszel:/extra-filesystems/sda1:ro
    environment:
      LISTEN: 45876
      KEY: 'SECRET_1'
      TOKEN: SECRET_2
      HUB_URL: http://YOUR_INSTANCE_IP:8090
⚠️ Heads-up: The default configuration actually skips over a pretty vital feature—SMART disk monitoring. If you want Beszel to track the health of your physical drives and warn you about potential failures, the agent needs a bit more ‘room to breathe’ so it can talk directly to your hardware.
To enable this, you’ll want to use the version below.
beszel-agent:
    image: henrygd/beszel-agent:alpine
    container_name: beszel-agent
    restart: unless-stopped
    network_mode: host
    privileged: true
    cap_add:
    - SYS_RAWIO # required for S.M.A.R.T. data
    - SYS_ADMIN # required for NVMe S.M.A.R.T. data
    volumes:
      - /var/run/docker.sock:/var/run/docker.sock:ro
      - /opt/beszel/beszel_agent_data:/var/lib/beszel-agent
      - /dev:/dev
      # monitor other disks / partitions by mounting a folder in /extra-filesystems
      - /BACKUP/.beszel:/extra-filesystems/sdb1:ro
    devices:  # Explicitly pass your disks (replace/add as needed)
      - /dev/sda:/dev/sda
    environment:
      LISTEN: 45876
      KEY: 'SECRET_1'
      TOKEN: SECRET_2
      HUB_URL: http://172.20.0.7:8090
      SMART_DEVICES:
        /dev/sda:sat,/dev/sdb:sat
⚠️ Here is what you need to change and why:
The
:alpineTag: We usehenrygd/beszel-agent:alpinebecause it comes pre-packaged withsmartmontools, which is the actual software that reads your disk health.network_mode: host: This allows the agent to see your host’s network interfaces directly to give you accurate bandwidth statistics.cap_add&devices: These give the container the specific “capabilities” and hardware access it needs to query your physical SSDs or HDDs without giving it full, unrestricted access to the whole system.HUB_URL: In this setup, we point the agent to the Beszel Hub’s internal Docker IP. This keeps your monitoring traffic isolated within Docker rather than sending it out to your router and back.SMART_DEVICES: This tells the agent exactly which disks to check and what “type” they are (likenvmeorsat).
Finding Your Disk Types
Before you update your config, you need to know how your system identifies your disks. You can find this using the smartctl utility on your host machine:
sudo apt install smartmontools
sudo smartctl --scan
/dev/sda -d sat # /dev/sda [SAT], ATA device
/dev/sdb -d sat # /dev/sdb [SAT], ATA device
As you can see, smartctl utility provides types of attached disks e. g. sat in my case.
After adding and adjusting Beszel Agent Docker compose config into your Home Assistant docker-compose.yml start your Docker container:
sudo docker compose up -d --remove-orphansIf you configured your Beszel Agent properly, you should see statistics of your system:
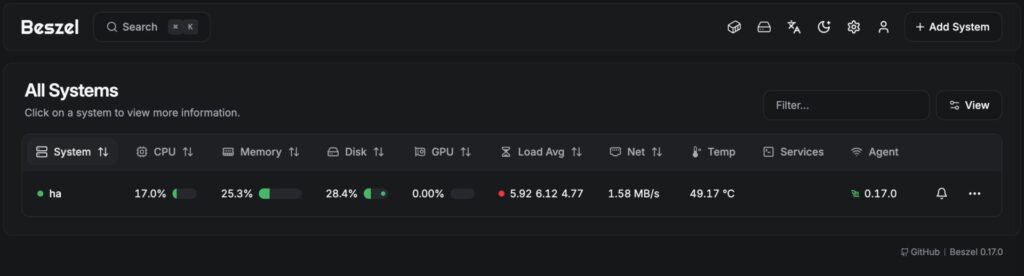
Your Beszel is configured, so you can start to integrate in into Home Assistant!
Home Assistant Configuration
Ingress Panel config for Beszel
Firtst of all, you have to install HACS_Ingress plugin into your Home Assitanse, so follow this article for instalation and initial config.
Beszel is very sensetive for URL paths, so you should be careful with configs to make it works.
1. Navigate to File Additor in your Home Assistant and add configuration below into HA configuration.yaml file:
ingress:
  beszel:
    work_mode: ingress
    title: "Beszel Hub"
    ui_mode: toolbar
    icon: "mdi:monitor-dashboard"
    url: "http://beszel:8090"
    # The 'rewrite' in NGINX for the request path is handled automatically here.
    # However, if Beszel's UI uses absolute paths (like "/static/main.js"),
    # you may need the body rewrite below:
    rewrite:
      # Fixes only the root-relative assets (prevents doubling up)
      - mode: body
        match: 'href="/assets/'
        replace: 'href="$http_x_ingress_path/assets/'
      - mode: body
        match: 'src="/assets/'
        replace: 'src="$http_x_ingress_path/assets/'
      # Fixes the main entry points
      - mode: body
        match: 'href="/manifest.json"'
        replace: 'href="$http_x_ingress_path/manifest.json"'
      - mode: body
        match: 'src="/_/'
        replace: 'src="$http_x_ingress_path/_/'
⚠️ Heads-up: The hostname in url must strictly correspond to your docler-compose config in beszel section: hostname: and aliases:
...
hostname: beszel
    networks:
     home_assistant:
       aliases:
         - beszel
       ipv4_address: 172.20.0.7
...
Also it must correspond to hostname in Home Assisstant section:
...
extra_hosts:
      - "beszel:172.20.0.7"
...
2. Reload Ingress config:
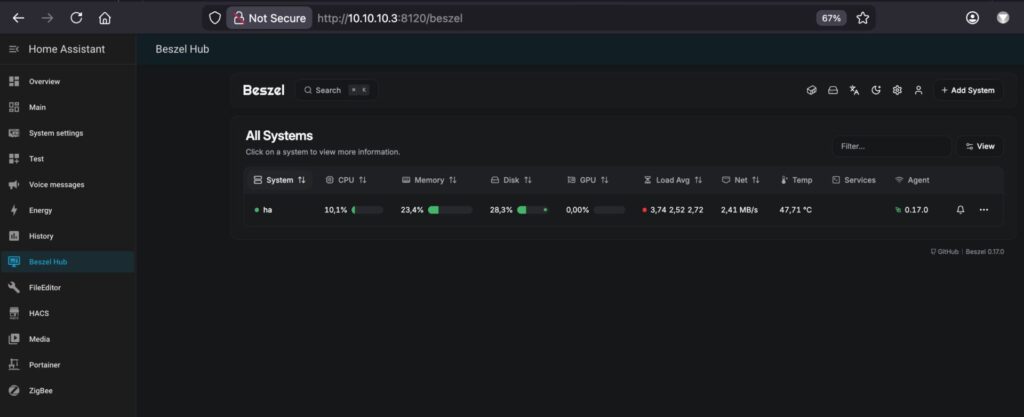
Now, you should see “Beszel Hub”, but if you click it in your Home Assistant sidebar, you will see a blank screen or a loading error, don’t panic. This happens because Home Assistant’s Ingress (the system that puts apps into the sidebar) adds a unique path prefix to the URL.
Basically, Beszel is looking for its files in the “lobby,” but Home Assistant has tucked it away in a “specific room.” We just need to tell Beszel where it’s being hosted so it can find its own assets.
The Fix: Setting the APP_URL
You’ll need to edit the Beszel Hub (not the agent) section of your docker-compose.yml file. Add the APP_URL environment variable and point it to your Home Assistant Ingress URL.
Here is how that section should look:
beszel:
    image: henrygd/beszel:latest
    container_name: beszel-hub
    restart: unless-stopped
    ports:
      - "8090:8090"
    volumes:
      - /opt/beszel/beszel_data:/beszel_data
    environment:
      - APP_URL=https://YOUR_DOMAIN:8123/api/ingress/beszel
    hostname: beszel
    networks:
     home_assistant:
       aliases:
         - beszel
       ipv4_address: 172.20.0.7
⚠️ Precision is Key: Building your APP_URL
To make this work, your APP_URL variable needs to be a combination of your Base Address and a Strict Path.
1. The Variable Part (Your Base Address)
This depends entirely on how you access Home Assistant:
Protocol: Use
https://if you have an SSL certificate (Nginx, Let’s Encrypt, Cloudflare), otherwise usehttp://.Domain/IP: Use your local IP (e.g.,
192.168.1.50) or your external domain (e.g.,myhome.duckdns.org).Port: Include your port (usually
:8123) unless you are using a proxy that hides it.
2. The Strict Part (The Ingress Path)
This part is non-negotiable. It must be exactly: /api/ingress/beszel
Note: Do not add a trailing slash or any extra characters at the end of this string, or the routing will break.
Apply you docker compose changes:
sudo docker compose up -d --remove-orphansNow Beszel should be accessible in your ingress panel.
⚠️ Heads-up:
Once you set the APP_URL to the Ingress path, Beszel expects that specific prefix (/api/ingress/beszel) to be part of every request. This creates a bit of a “Catch-22” for how you log in:
Option A: Integrated Mode (Home Assistant Sidebar)
Setup:
APP_URLis configured in yourdocker-compose.yml.Result: It works perfectly inside your Home Assistant UI, but if you try to go to
http://YOUR_IP:8090directly, the page will likely be blank or show “404 Not Found” errors because the paths don’t match.
Option B: Standalone Mode (Direct Access)
Setup:
APP_URLis removed or commented out.Result: You can access Beszel directly at
http://YOUR_IP:8090, but the sidebar link in Home Assistant will break.
Why can’t I have both?
Beszel’s web server needs to know its “Base URL” to serve its internal files (like images and scripts). It can only have one Base URL at a time. When we set it to the Ingress path, we are telling the app: “You no longer live at the front door; you now live in the ‘Home Assistant’ room.”
How to switch back?
If you decide you’d rather use Beszel as a standalone app and don’t care about the sidebar integration:
Open your
docker-compose.yml.Delete or comment out (
#) the line forAPP_URL.Run
docker-compose up -dto apply the changes.Access it directly via its IP and Port.
Add Beszel Statistics to Home Assistant as Sensors.
While you can find several Beszel integrations in HACS, most currently lack support for S.M.A.R.T. disk health. To bridge this gap, we’ll use Home Assistant’s REST API sensors to pull that data directly.
Why integrate if you already have the UI?
The answer is simple: Actionable Notifications. Having a dashboard is great, but you don’t want to be checking it manually every hour. By bringing these metrics into Home Assistant, you can automate alerts for:
Thermal Protection: Get notified of system overheating if a fan fails or ambient temperatures spike.
Drive Health: Receive a heads-up on disk degradation before it turns into a data-loss disaster.
The Integration Strategy: 3 Key Endpoints
Beszel’s API (built on PocketBase) is robust but requires a specific workflow to access data securely. We will set up three separate REST sensors to handle the following:
The Access Token (Authentication): For security, Beszel doesn’t allow “anonymous” data scraping. We first need to send your credentials to an authentication endpoint to receive a temporary bearer token.
General System Metrics: Once we have our token, this endpoint provides the “bread and butter” stats: CPU load, RAM usage, and system temperatures.
S.M.A.R.T. Data: Because hardware-level disk health is a bit more specialized, it lives in its own endpoint. This is where we’ll grab those vital signs for your HDDs and SSDs.
By the end of this setup, you’ll have a complete set of sensors ready for your Home Assistant dashboard and automation engine.
Get Access Tocken
Let’s start with the first sensor for getting an access token and storing it for further usage.
Navigate to File Additor in your Home Assistant and add the configuration below into HA configuration.yaml file:
rest:
 - resource: "http://beszel:8090/api/collections/_superusers/auth-with-password"
   method: POST
   payload: '{"identity":"YOUR_USERNAME", "password":"YOUR_PASSWORD"}'
   timeout: 30
   headers:
      Content-Type: "application/json"
   scan_interval: 12000
   sensor:
    name: "Beszel API Token"
    value_template: '{{ value_json.token }}'   # Shows first part of token or error
    json_attributes:
      - record
⚠️ Heads-up:
To make sure this works on the first try, pay close attention to these three things:
The Resource URL: The hostname in the URL (
beszelin my example) must strictly match the name or alias you gave the Beszel container in yourdocker-compose.yml. Since they are in the same Docker network, HA will find it by name.Credentials: Replace
YOUR_USERNAMEandYOUR_PASSWORDwith the admin credentials you created when you first opened the Beszel web interface.The “First Time” Restart: This is a common trap! If this is your first time adding a
rest:sensor to Home Assistant, a simple “Reload YAML” won’t work. You must go to Settings > System and perform a full Restart to initialize the REST integration.
Otherwise, you can reload your REST entities:
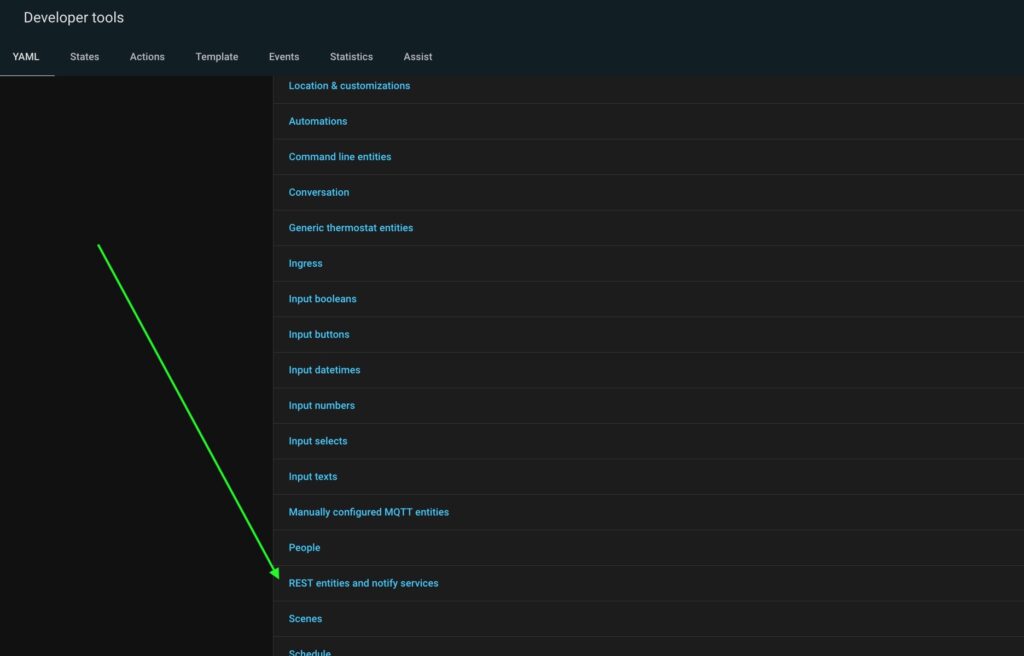
Once Home Assistant has restarted, let’s make sure it successfully grabbed the token:
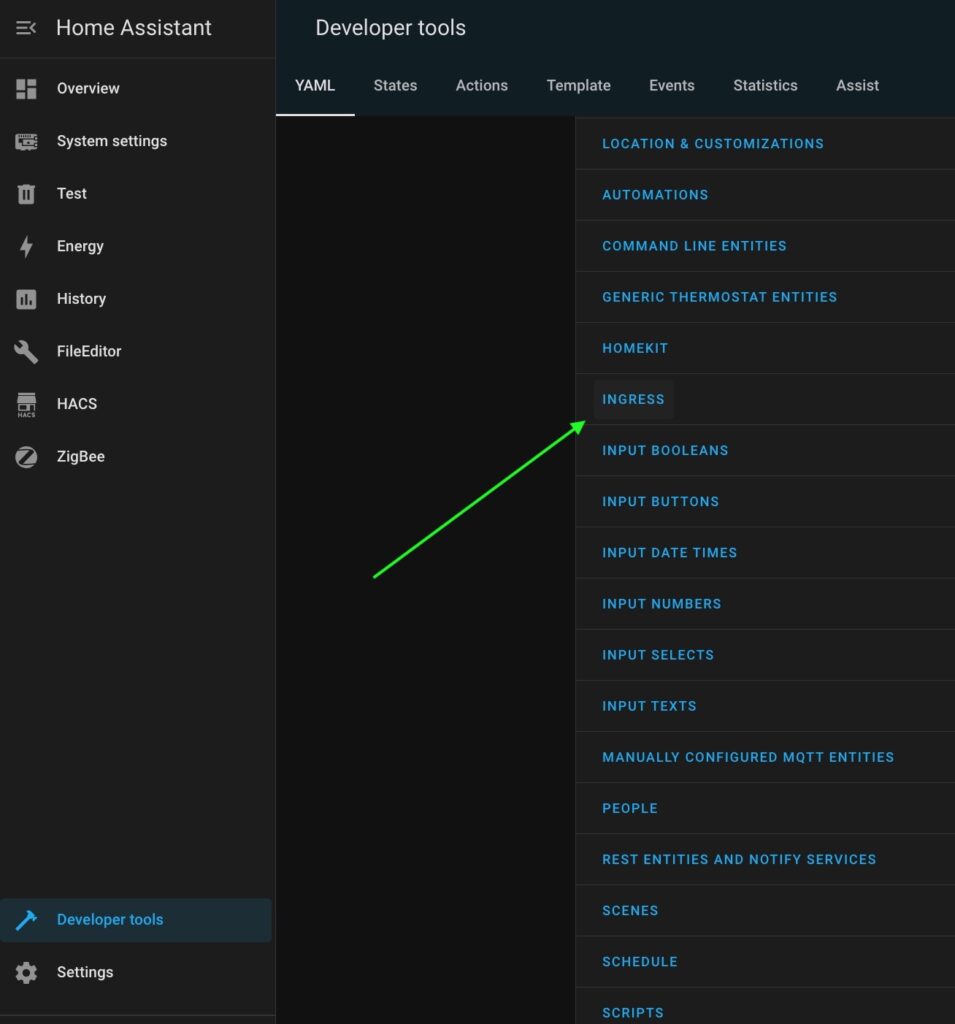
Navigate to Developer Tools > States.
Search for
sensor.beszel_api_token.The Result: If everything is correct, the “State” column should be filled with a long string of random characters. That is your active token!
Pro-Tip: If the state says unknown or unavailable, check your Home Assistant logs (Settings > System > Logs). It will usually tell you if there was a connection timeout or an “Unauthorized” error due to a typo in your password.
Get Generic information
Back to File Additor in your Home Assistant and add the configuration below into HA configuration.yaml file:
 - resource: "http://beszel:8090/api/collections/systems/records/System_ID"
   method: GET
   headers:
     Authorization: "Bearer {{ states('sensor.beszel_api_token') }}"
     Content-Type: "application/json"
   scan_interval: 60
   sensor:
      - name: "Beszel HA Server Status"
        value_template: "{{ value_json.status }}"
        icon: mdi:server
      - name: "Beszel HA CPU Usage"
        value_template: "{{ value_json.info.cpu | round(1) | default('unknown') }}"
        unit_of_measurement: "%"
        icon: mdi:cpu-64-bit
      - name: "Beszel HA RAM Usage"
        value_template: "{{ value_json.info.mp | round(1) | default('unknown')}}"
        unit_of_measurement: "%"
        icon: mdi:memory
      - name: "Beszel HA Disk Usage"
        value_template: "{{ value_json.info.dp | round(1) | default('unknown')}}"
        unit_of_measurement: "%"
        icon: mdi:harddisk
      - name: "Beszel HA Temperature"
        value_template: "{{ value_json.info.dt | round(1) | default('unknown')}}"
        unit_of_measurement: "°C"
        icon: mdi:thermometer
      - name: "Beszel HA Network Throughput"
        value_template: "{{ value_json.info.b | round(2) | default('unknown')}}"
        unit_of_measurement: "MB/s"
        icon: mdi:transfer
      - name: "Beszel HA /BACKAP Usage"
        unique_id: "beszel_ha_sdb1_usage"
        # Accesses the specific partition key
        value_template: >
          {{ value_json.info.efs.sdb1 | default(0) }}
        unit_of_measurement: "%"
        icon: mdi:partition
⚠️ Heads-up:
To make sure this works on the first try, pay close attention to the following things:
The Resource URL: The hostname in the URL (
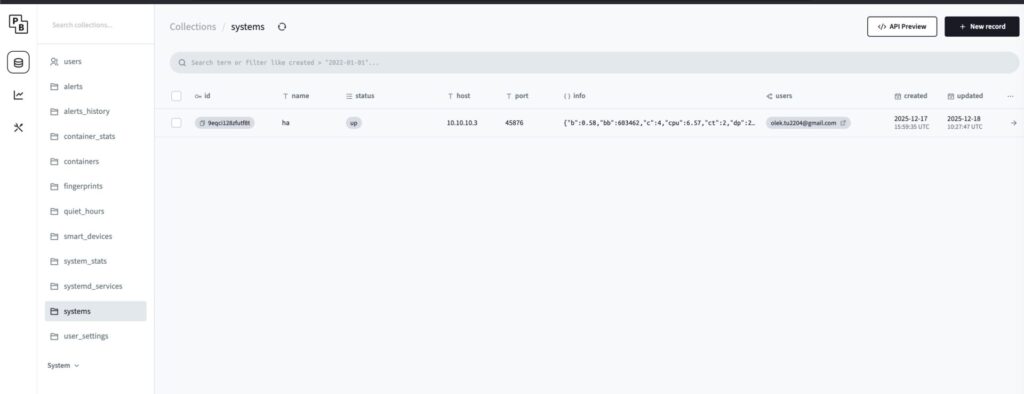
beszelin my example) must strictly match the name or alias you gave the Beszel container in yourdocker-compose.yml. Since they are in the same Docker network, HA will find it by name.System_ID: While Beszel’s API can return data for every system you have registered at once, I don’t recommend doing it that way. Parsing a giant “blob” of data for multiple machines makes troubleshooting much harder. It’s much cleaner to create a dedicated sensor for each system using its unique ID.
How to Find Your System ID
Open your Beszel Web UI.
Click on the “Person” icon (Account/User menu) in the top-right corner.
Select the Systems menu.
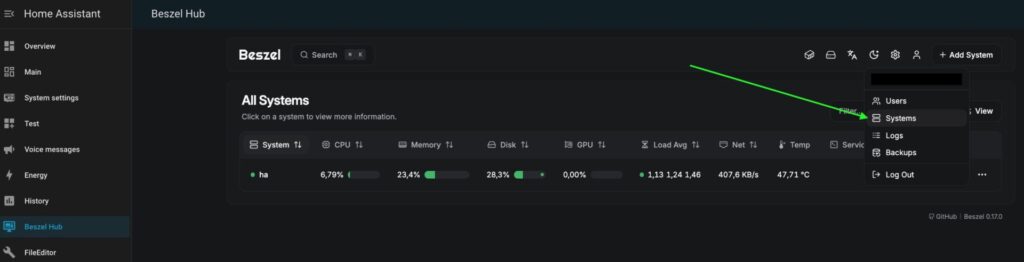
4. Find the system you want to monitor (e.g., “Home Assistant”) and look for the ID column. It will be a string of random letters and numbers (like 7j3n2k9m4l).
Names and unique_id: Adjust them according to your wishes.
Mount points: Beszel checks attached partitions’ usage by devices names. So, your template {{ value_json.info.efs.sdb1 | default(0) }} must be corresponded to disk name sdb1 in Beszel Agent configuration:
    volumes:
      - /BACKUP/.beszel:/extra-filesystems/sdb1:ro
The Restart: After you restart Home Assistant, you might notice that your new sensors show a status of “Unknown” Don’t panic! This is perfectly normal behavior. Here’s why it happens:
The Race Condition: Home Assistant fires off all its REST API calls simultaneously when it boots up.
The Token Delay: Your data sensors (System Stats and SMART data) are trying to talk to Beszel at the exact same time the “Token Sensor” is trying to get authenticated.
The Result: Because the data sensors don’t have a valid token yet, Beszel rejects their first request.
The Fix: Just wait for the next “update interval” (usually a minute or two). On the second try, the Token Sensor will have its data ready, and your metrics will pop into life.
Get SMART information
Back to File Additor in your Home Assistant and add the configuration below into HA configuration.yaml file:
 - resource: "http://beszel:8090/api/collections/smart_devices/records/Disk_ID"
   method: GET
   headers:
      Authorization: "Bearer {{ states('sensor.beszel_api_token') }}"
      Content-Type: "application/json"
   scan_interval: 120
   sensor:
      - name: "Beszel HA SDA Health"
        unique_id: "beszel_sda_health_id"
        value_template: "{{ value_json.state | default('unknown')}}"
      - name: "Beszel HA SDA Temp"
        unique_id: "beszel_sda_temp_id"
        value_template: "{{ value_json.temp | default('unknown')}}"
        unit_of_measurement: "°C"
      - name: "Beszel HA SDA Pending Sectors"
        unique_id: "beszel_sda_pending_id"
        value_template: "{{ value_json.attributes | selectattr('id', 'eq', 197) | map(attribute='rv') | first | default(0) }}"
⚠️ Heads-up:
To make sure this works on the first try, pay close attention to the following things:
The Resource URL: The hostname in the URL (
beszelin my example) must strictly match the name or alias you gave the Beszel container in yourdocker-compose.yml. Since they are in the same Docker network, HA will find it by name.Disk_ID: Just like the System ID, we need a specific Disk ID to pull the S.M.A.R.T. data. Since each physical drive has its own unique health record in Beszel’s database, you need to point Home Assistant to the exact one you want to monitor.
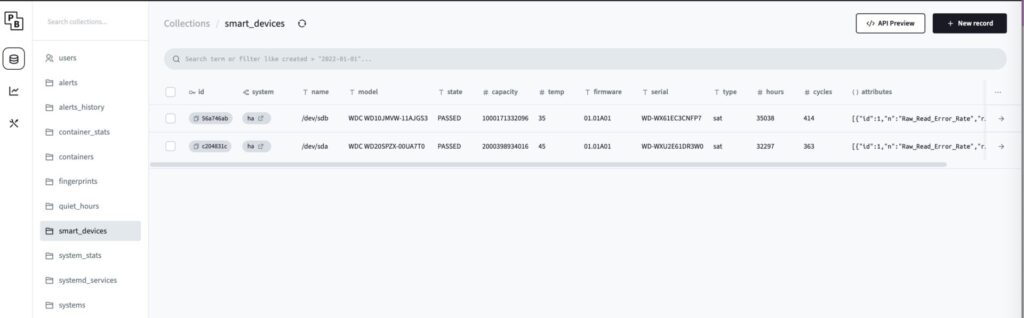
To find your Disk ID, follow the same path as before:
In the window opened in the previous step backend settings window), look for the smart_devices menu on the left side panel.
Find the disk you want to track (e.g.,
/dev/sdaor your NVMe drive).Copy the string from the ID column for that specific disk.
Names and unique_id: Adjust them according to your wishes.
- The Restart: Again, you will be faced with “Unknown” sensors states, but you already know how to deal with it.
Conclusion
Congratulations! You have successfully turned Beszel from a standalone dashboard into a deeply integrated engine for your Home Assistant setup.
By setting up these REST sensors, you’ve done something most off-the-shelf integrations can’t: you’ve gained direct access to your hardware’s “vital signs,” specifically those crucial S.M.A.R.T. disk stats.
- Now that your data is in Home Assistant, you should set up an automation to alert you before a “minor glitch” becomes a “total loss.”
Here you can find the article on how to create a universal script for notifications. - Create a dashboard lovelance cards with the most interesting metrics.
Here you can find YAML configs for such cards, so you will need to replace sensors’ names with your own.