Home Assistant users often rely on built-in integrations for weather forecasting, but what if you could gain more control, transparency, and insight into the data driving your automations? By tapping directly into the REST API from met.no —the official source behind the popular weather service—you can pull in accurate, hyperlocal forecast data without relying on opaque built-in components.
This approach doesn’t just offer flexibility—it’s a powerful tool for debugging and understanding how your weather-dependent automations behave. Unlike Home Assistant’s default weather integrations, using met.no’s API directly means you can inspect raw responses, tweak queries, and handle the data exactly how you want. In this article, we’ll explore how to set it up, the advantages it brings, and why this method might just become your go-to for weather integration in Home Assistant.
Home Assistant default met.no integration overview
In the 2025 version of Home Assistant, the met.no integration remains a built-in weather platform that fetches data from the MET Norway API, providing current conditions and forecasts for a specified location. It creates a weather entity (e.g., weather.home) with attributes like temperature, humidity, and wind speed.
The integration now supports direct access to forecast data through variables in automations. Theoretically, it should simplify the process of extracting specific forecast metrics (e.g., hourly precipitation) without needing to parse attributes manually.
But let’s see the following example of getting a forecast:
automation:
  - alias: "Notify High Precipitation Next Hour"
    trigger:
      - platform: time_pattern
        minutes: "/10"  # Check every 10 minutes (matches met.no polling)
    action:
      - service: weather.get_forecasts
        data:
          entity_id: weather.home
          type: hourly
        response_variable: hourly_forecast
      - condition: template
        value_template: >
          {% set next_hour = hourly_forecast['weather.home'].forecast
            | selectattr('datetime', 'eq', (now().replace(minute=0, second=0, microsecond=0) + timedelta(hours=1)).isoformat())
            | first %}
          {{ next_hour is not none and next_hour.precipitation | float(0) > 2 }}
      - service: notify.notify
        data:
          message: >
            High precipitation expected next hour: {{ (hourly_forecast['weather.home'].forecast
              | selectattr('datetime', 'eq', (now().replace(minute=0, second=0, microsecond=0) + timedelta(hours=1)).isoformat())
              | first).precipitation }} mm. Consider pausing irrigation.
Stores the forecast in the hourly_forecast variable.
In Home Assistant, the variables defined inside an automation or script are only available within that automation’s runtime context. That means:
❌ You cannot access the hourly_forecast variable outside the automation,
❌ nor can you view it in Developer Tools or use it elsewhere directly.
Comparison: Default Met.no Integration vs REST API Sensor
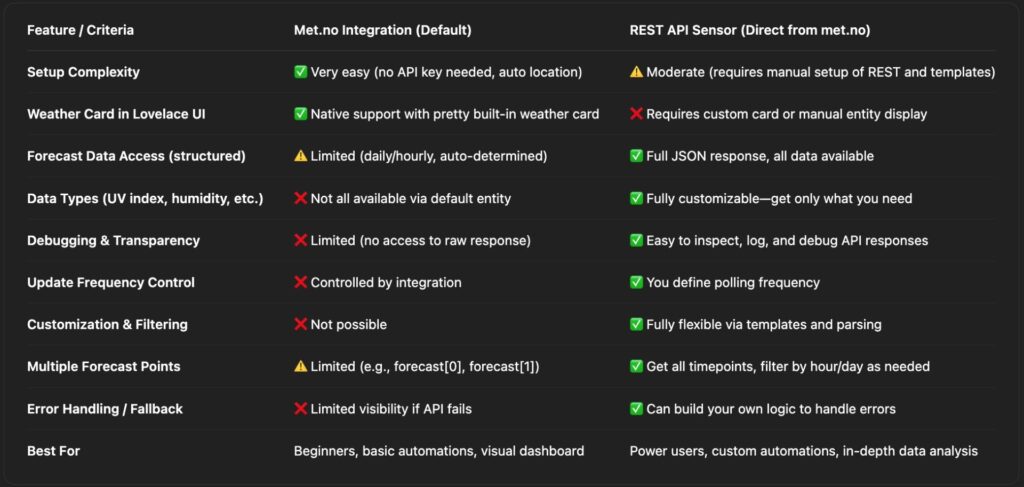
💡 Summary
Use the Met.no integration if you want a quick, visually appealing setup with basic weather automation needs.
Use the REST API sensor if you need full control over the data, want specific forecast values (like UV index or humidity), and are comfortable working with JSON and templates.
Use both if you would like to combine best features of them.
Met.no REST sensor configuration
- Use the /complete endpoint for full forecast data, which includes precipitation.
- Specify coordinates (latitude and longitude) for your location (e.g., lat=52.52 and lon=13.405).
- Provide a User-Agent header, as MET Norway requires identification for API requests.
- MET Norway’s API is free but has usage limits (not publicly specified, typically thousands of requests per day). Avoid excessive polling to prevent being blocked.
- Forecasts are updated hourly, but for daily data, we’ll aggregate hourly values into daily totals.
- The API returns UTC timestamps, so you’ll need to handle timezone conversion for your location.
Step 1: Get Your Location Coordinates
Go to Settings > System > General
- Click on Edit button on “Edit location” section, check if your location configured without mistake.
Copy your:
Latitude
Longitude
- Close “Edit location“.
You’ll use those in the REST URL:
https://api.met.no/weatherapi/locationforecast/2.0/complete?lat=YOUR_LAT&lon=YOUR_LON
Replace YOUR_LAT and YOUR_LON with your coordinates.
Example:
https://api.met.no/weatherapi/locationforecast/2.0/complete?lat=52.52&lon=13.405
💡 Pro Tip: It’s a good practice to test your URL in a browser first. This helps verify that the endpoint is correct and returns the expected data before integrating it into Home Assistant.
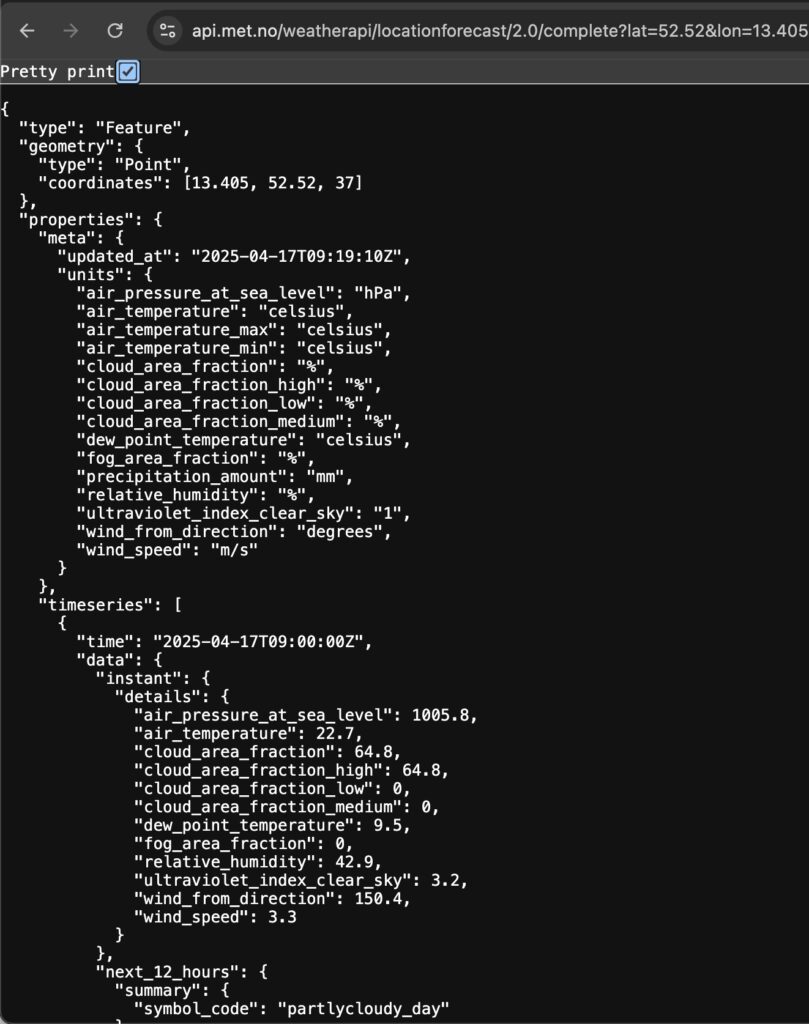
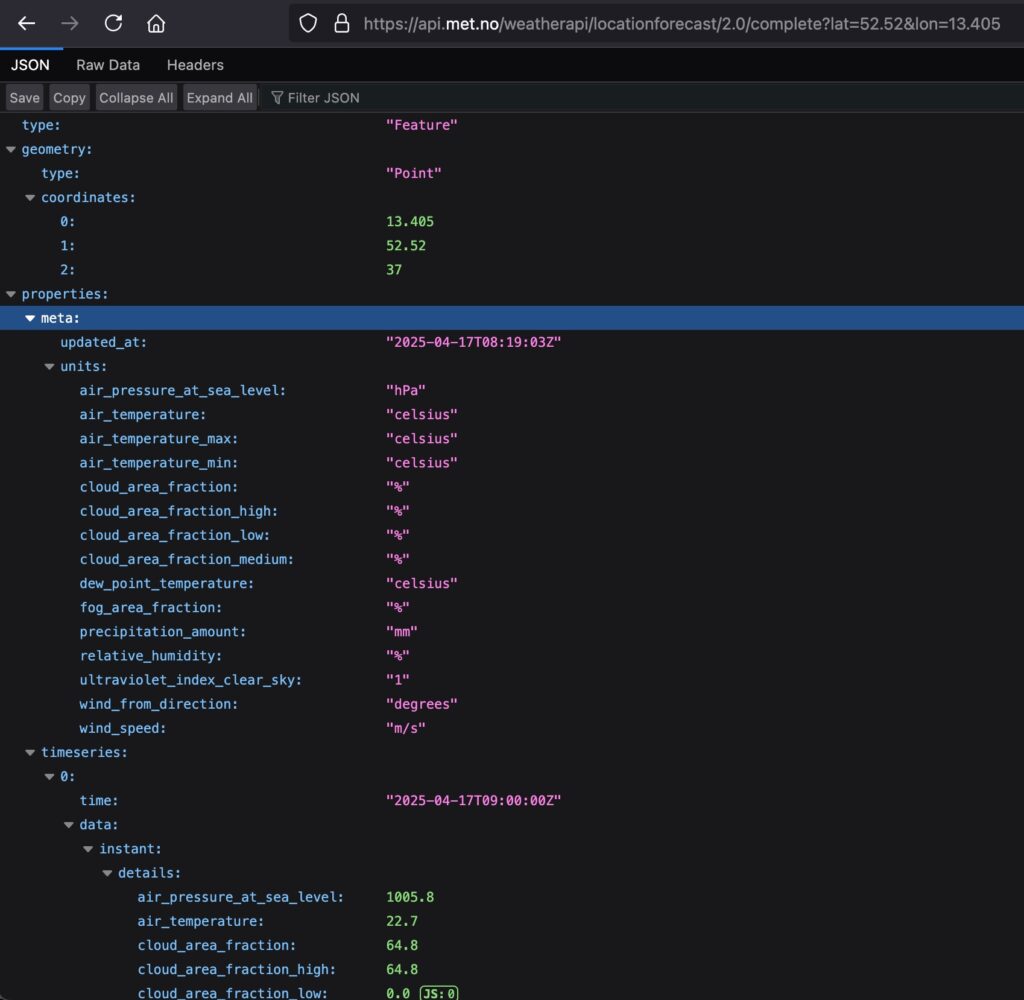
💡 Pro Tip: Firefox displays JSON responses in a structured and user-friendly format, making it easier to understand and debug API results.
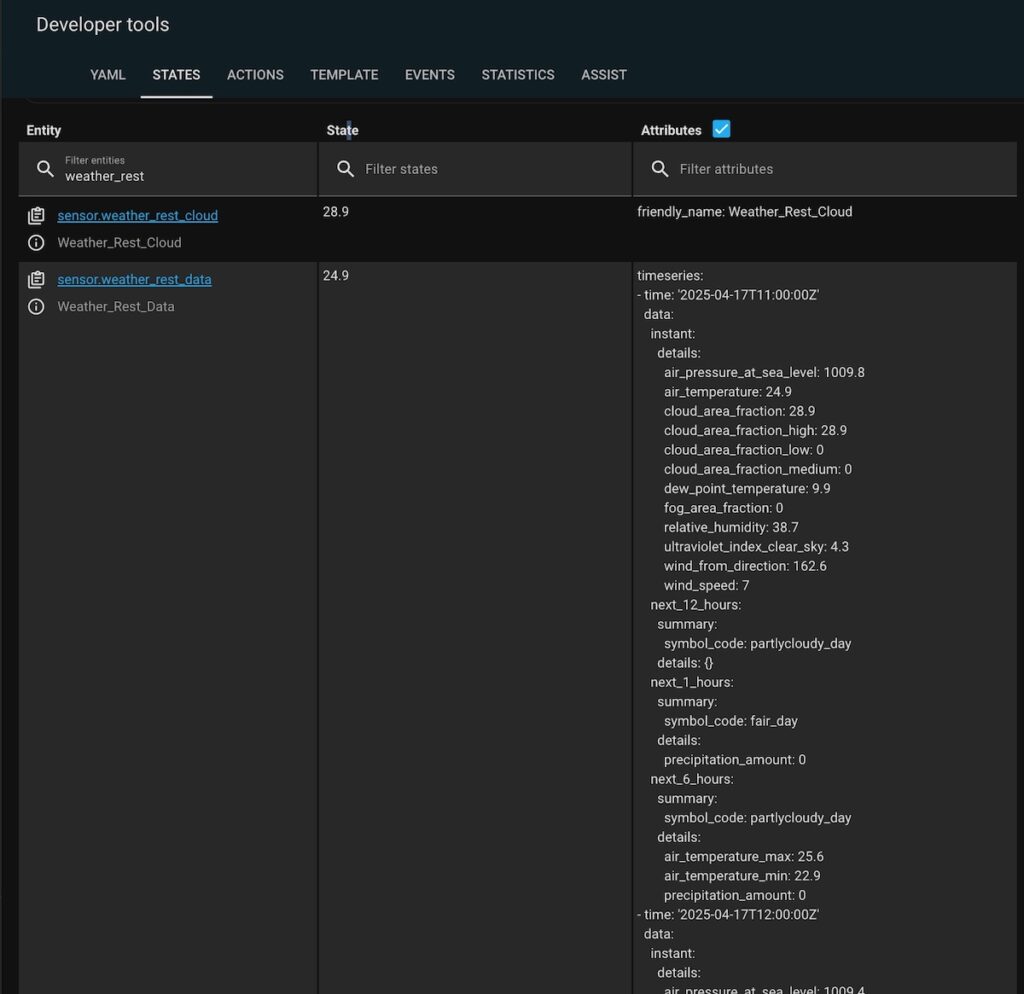
🔍 Note: Pay close attention to the “properties” section in the JSON response. It contains a comprehensive list of all parameters provided by met.no, along with their respective measurement units—an essential reference for correctly interpreting the weather data.
Step 2: Configure REST API sensor
Home Assistant’s RESTful Sensor integration allows us to fetch data from the MET Norway API and parse it into a sensor. We’ll configure this in your configuration.yaml file.
For this purpose, make sure the “File Editor” add-on is installed.
If you’re unsure how to install it, refer to the chapter “Install ‘File Editor’ Plugin in Home Assistant” earlier in this article for step-by-step instructions.
Edit your configuration.yaml (or create a new file under sensors/ if using split configuration). Add the following REST sensor to fetch MET Norway data:
rest:
- resource: "hhttps://api.met.no/weatherapi/locationforecast/2.0/complete?lat=YOUR_LAT&lon=YOUR_LON"
method: GET
headers:
User-Agent: "Mozilla/5.0 (Windows NT 10.0; Win64; x64) AppleWebKit/537.36 (KHTML, like Gecko) Chrome/110.0.0.0 Safari/537.36"
Accept: "application/ld+json"
scan_interval: 1800 # Update every hour
timeout: 30
sensor:
- name: "Weather_Rest_Data"
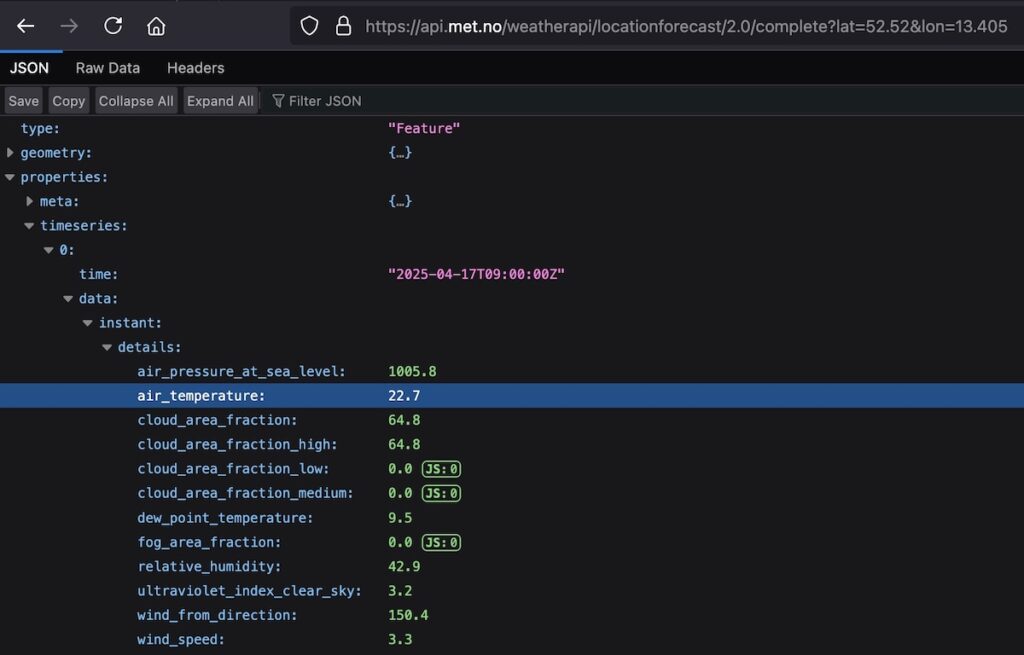
value_template: "{{ value_json.properties.timeseries[0].data.instant.details.air_temperature | default('unknown') }}"
unit_of_measurement: "°C"
json_attributes_path: $.properties
json_attributes:
- timeseries
- name: "Weather_Rest_Humidity"
value_template: "{{ value_json.properties.timeseries[0].data.instant.details.relative_humidity | default('unknown') }}"
unit_of_measurement: "%"
- name: "Weather_Rest_UVIndex"
value_template: "{{ value_json.properties.timeseries[0].data.instant.details.ultraviolet_index_clear_sky | default('unknown') }}"
- name: "Weather_Rest_Cloud"
value_template: "{{ value_json.properties.timeseries[0].data.instant.details.cloud_area_fraction | default('unknown') }}" 💡 Explanation:
- resource: The MET Norway API endpoint for Wroclaw.
- method: GET – API doesn’t support POST method
- headers: MET Norway requires a User-Agent header, so the provided string in the example above mimics a common browser request.
- scan_interval: 1800 seconds (1/2 hour) aligns with the API’s update frequency, minimizing requests to stay within rate limits.
- sensor: I get 3 sensors for further usage in my automations:
- “Weather_Rest_Data” – this sensor holds current temperature and the whole REST API response.
- value_template: “{{ value_json.properties.timeseries[0].data.instant.details.air_temperature | default(‘unknown’) }}”
Extracts the temperature value for a current hour according to JSON path:
- json_attributes: Pulls the properties object, which contains the whole forecast data from timeseries.
- Additional sensors: “Weather_Rest_Humidity”, “Weather_Rest_UVIndex”, Weather_Rest_Cloud” – get the current humidity, UV index, and cloudy conditions.
- json_attributes: Pulls the properties object, which contains the whole forecast data from timeseries.
You can tailor this set of sensors to suit your specific needs by extracting the required data points from the API. Simply identify the relevant fields in the JSON response and adjust your configuration accordingly.
💾 Save and Restart Required
Don’t forget to save your configuration.yaml file after making changes. If you’re adding your first REST sensor, simply reloading YAML from the Developer Tools won’t be sufficient. In this case, you need to restart Home Assistant Core from the Settings > System > Restart menu to properly apply the changes.
Step 3: CHECK YOUR CONFIGURATION
🔍 Verify REST Integration
First, ensure that the REST integration has been successfully recognized by Home Assistant. You can check this by navigating to Settings > System > Devices & Services. If the integration appears there, your configuration has been loaded correctly.
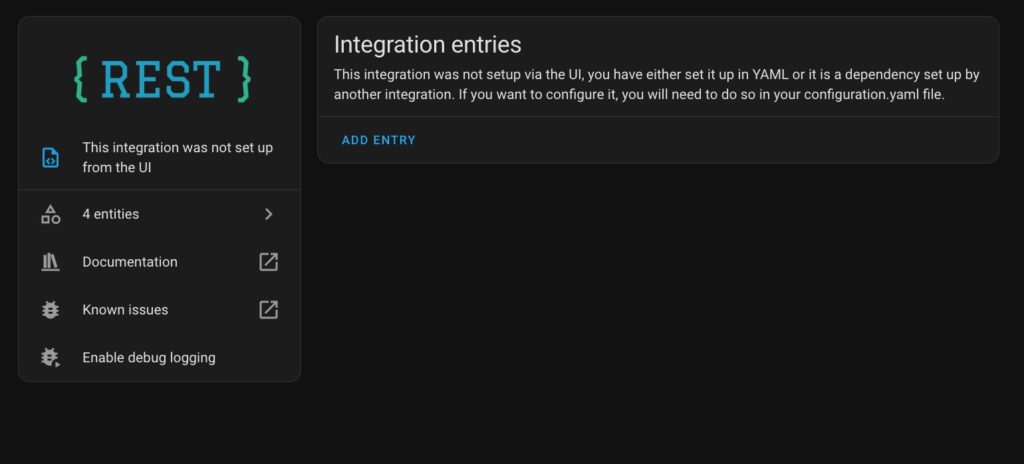
🔍 Inspect REST Entities
Next, click on your newly created REST entities. Ensure that they are returning valid values. If the values are empty or show errors, double-check your configuration and the data structure of the API response.
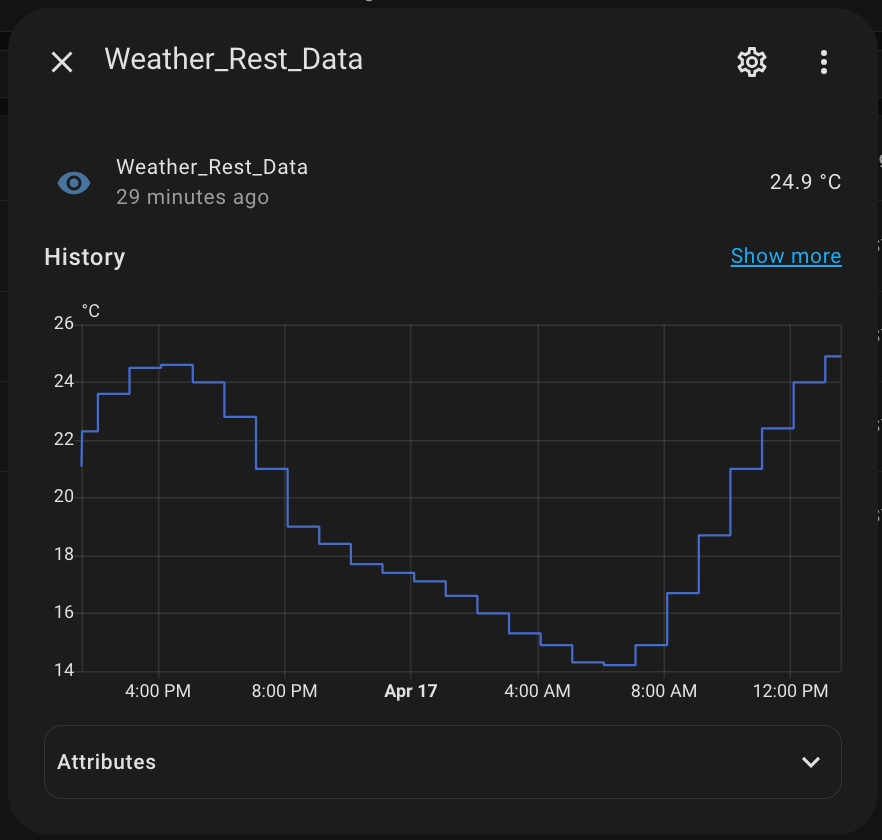
Naturally, your graph will appear empty right after adding a new sensor, as historical data hasn’t accumulated yet. However, the current value should be visible immediately. If your sensors are showing an “unknown” state, it’s a sign that something isn’t working as expected—check the Home Assistant logs (Settings > System >Logs) for any errors related to your REST configuration or API access.
After that, navigate to Developer Tools > States in Home Assistant. Here, you can confirm whether your sensor has successfully gathered all the necessary data. Look for the current state and available attributes to ensure everything is functioning as expected and corresponds to the data displayed in your browser.
Step 4: Write Template code for Daily Precipitation Summaries
The met.no API provides precipitation_amount on an hourly basis. To obtain a daily total, we need to calculate the sum of all hourly values. In this example, we’ll start by calculating the forecasted precipitation amount for tomorrow. This will help illustrate how to build a template sensor while taking into account both local and API-provided time zone differences—a crucial step for accurate data processing.
Here the yaml code for the sensor:
{% set tomorrow = (now().replace(hour=0, minute=0, second=0, microsecond=0) + timedelta(days=1, hours=-2)) %}
{% set tomorrow_end = tomorrow + timedelta(days=1) %}
{% set tomorrow_bg = as_timestamp(tomorrow.strftime('%Y-%m-%d %H:%M:%S')) | timestamp_local%}
{% set tomorrow_ed = as_timestamp(tomorrow_end.strftime('%Y-%m-%d %H:%M:%S')) | timestamp_local%}
 {{ state_attr('sensor.weather_rest_data', 'timeseries')
   | rejectattr('time','lessthan',tomorrow_bg)
   | rejectattr('time','gt',tomorrow_ed)
   | map(attribute='data.next_1_hours.details.precipitation_amount')
   | map('float', 0)
   | sum
   | round(2)
}}Step 1: Refresh Your REST Sensor
Start by refreshing your REST sensor to ensure you have the latest data:
Navigate to Developer Tools > YAML Configuration Reloading.
Click on REST Entities and Notify Services to reload the integration.
Next, verify the sensor is working correctly:
Go to Settings > Devices & Services.
Locate and click on the RESTful integration.
Click on Entities, then select your sensor (e.g.,
Weather_Rest_Data).Check the last updated timestamp displayed under the sensor’s name to confirm it’s receiving fresh data. (Refer to the “Entity Value” image above if needed.)
Step 2: Use the Template Editor
Now, let’s inspect the REST data output using the Template Editor:
Open Developer Tools > Template.
Paste the following code:
{{(now())}}
{{(utcnow()) }}
You should now see the following results in the Template Editor’s Result Panel:
2025-04-18 10:31:00.485764+02:00— This represents your local current time along with your time zone offset. In this example, the offset is +2 hours.2025-04-18 08:31:00.485849+00:00— This is the current time in the UTC time zone.
💡 Note: While I’m aware that UTC isn’t exactly the same as GMT, Home Assistant doesn’t offer a built-in GMT function. That said, UTC and GMT are close enough for the purpose of our calculations and understanding the time zone differences in forecast data. You’ll have another date because there is represented the date of this article accomplishing.
Therefore, the data provided by met.no carries a time offset — in this case, 2 hours behind local time. This means that the forecast for tomorrow (in local time) actually spans from 10:00 PM today to 10:00 PM tomorrow in the met.no GMT-based timestamps. In other words, to align with local calendar days, you should extract data from today’s midnight to tomorrow’s midnight local time, which corresponds to 10:00 PM to 10:00 PM GMT in the forecast data.
I hope this explanation makes things clear enough to move forward. Now let’s break down the sensor code shown above, step by step:
{% set tomorrow = (now().replace(hour=0, minute=0, second=0, microsecond=0) + timedelta(days=1, hours=-2)) %}
{% set tomorrow_end = tomorrow + timedelta(days=1) %}
{% set tomorrow_bg = as_timestamp(tomorrow.strftime('%Y-%m-%d %H:%M:%S')) | timestamp_local%}
{% set tomorrow_ed = as_timestamp(tomorrow_end.strftime('%Y-%m-%d %H:%M:%S')) | timestamp_local%}

Tomorrow start
{{tomorrow}}
{{tomorrow_bg}}

Tomorrow end
{{tomorrow_end}}
{{tomorrow_ed}}
This piece of code calculates two timestamps that represent the beginning and end of tomorrow. These variables are essential for extracting tomorrow’s data from the JSON object stored in the sensor.
In the Result panel, you should see something like this:
Tomorrow start2025-04-18 22:00:00+02:002025-04-18T22:00:00+02:00
Tomorrow end2025-04-19 22:00:00+02:002025-04-19T22:00:00+02:00
As you can see, each timestamp is represented in two formats. Although they appear nearly identical, there’s a crucial distinction: the first is a string, while the second is a proper timestamp object. The timestamp format is required for accurate time-based calculations later on.
💡 Note: Pay close attention to the timedelta(days=1, hours=-2) function!
The hours=-2 parameter explicitly defines the time offset. In this case, it adjusts for a 2-hour difference between the local time and the UTC-based timestamps provided by the API. Getting this offset right is critical for aligning forecast data with your actual local day.
To see the next step change your code according to the following example:
{% set tomorrow = (now().replace(hour=0, minute=0, second=0, microsecond=0) + timedelta(days=1, hours=-2)) %}
{% set tomorrow_end = tomorrow + timedelta(days=1) %}
{% set tomorrow_bg = as_timestamp(tomorrow.strftime('%Y-%m-%d %H:%M:%S')) | timestamp_local%}
{% set tomorrow_ed = as_timestamp(tomorrow_end.strftime('%Y-%m-%d %H:%M:%S')) | timestamp_local%}
{{ state_attr('sensor.weather_rest_data', 'timeseries')
    | rejectattr('time','le',tomorrow_bg)
    | rejectattr('time','gt',tomorrow_ed)
    | map(attribute='time')
    | list
}}

Tomorrow start
{{tomorrow_bg}}

Tomorrow end
{{tomorrow_ed}}
This part of the code filters the JSON records to include only those with timestamps later than the start of tomorrow and earlier than the end of tomorrow, using the rejectattr() function. Additionally, it extracts only the time fields from each matching record to create a concise, easy-to-read list. This makes it convenient to verify whether the filtering logic is working as expected.
You should see a result similar to this in the Result Panel:
[‘2025-04-18T22:00:00Z‘, ‘2025-04-18T23:00:00Z’, ‘2025-04-19T00:00:00Z’, ‘2025-04-19T01:00:00Z’, ‘2025-04-19T02:00:00Z’, ‘2025-04-19T03:00:00Z’, ‘2025-04-19T04:00:00Z’, ‘2025-04-19T05:00:00Z’, ‘2025-04-19T06:00:00Z’, ‘2025-04-19T07:00:00Z’, ‘2025-04-19T08:00:00Z’, ‘2025-04-19T09:00:00Z’, ‘2025-04-19T10:00:00Z’, ‘2025-04-19T11:00:00Z’, ‘2025-04-19T12:00:00Z’, ‘2025-04-19T13:00:00Z’, ‘2025-04-19T14:00:00Z’, ‘2025-04-19T15:00:00Z’, ‘2025-04-19T16:00:00Z’, ‘2025-04-19T17:00:00Z’, ‘2025-04-19T18:00:00Z’, ‘2025-04-19T19:00:00Z’, ‘2025-04-19T20:00:00Z’, ‘2025-04-19T21:00:00Z’]
Tomorrow start
2025-04-18T22:00:00+02:00
Tomorrow end
2025-04-19T22:00:00+02:00
As you can see, the list begins exactly at the tomorrow start time and ends just before the tomorrow end.
✅ This is the perfect moment to double-check your time zone offset. Make sure that the records fall exactly within the expected range — otherwise, the aggregation might lead to inaccurate results.
Let’s get precipitation hourly amounts by replacing map(attribute=’time’) parameter with map(attribute=’data.next_1_hours.details.precipitation_amount’)
{% set tomorrow = (now().replace(hour=0, minute=0, second=0, microsecond=0) + timedelta(days=1, hours=-2)) %}
{% set tomorrow_end = tomorrow + timedelta(days=1) %}
{% set tomorrow_bg = as_timestamp(tomorrow.strftime('%Y-%m-%d %H:%M:%S')) | timestamp_local%}
{% set tomorrow_ed = as_timestamp(tomorrow_end.strftime('%Y-%m-%d %H:%M:%S')) | timestamp_local%}
{{ state_attr('sensor.weather_rest_data', 'timeseries')
    | rejectattr('time','le',tomorrow_bg)
    | rejectattr('time','gt',tomorrow_ed)
    | map(attribute='data.next_1_hours.details.precipitation_amount')
    | list
}}
At this stage, you should see a result similar to the following in the Result Panel:
[0.0, 0.0, 0.0, 0.0, 0.0, 0.0, 0.0, 0.0, 0.2, 0.0, 0.0, 0.2, 0.1, 0.0, 0.0, 0.0, 0.0, 0.0, 0.0, 0.0, 0.0, 0.0, 0.0, 0.0]
This array represents the hourly precipitation amounts for the upcoming day. You can verify the accuracy of this data by comparing it with the raw forecast returned by the API URL in your browser (as explained in the earlier section “Step 2: Configure REST API Sensor”). Keep in mind that the actual values will vary based on your location and the forecast at the moment.
To calculate the total forecasted precipitation for tomorrow, update your template to replace | list with the following pipe chain:
| map(‘float’, 0) – defining data type as a float
| sum – summarising precipitation amount for a whole day
| round(2) – rounding the result up to 2 decimals.
This will yield a single float value representing the total rainfall expected for the entire day. The final code is represented at the beginning of this chapter.
To calculate the total forecasted precipitation for today use following code:
{% set today = (now().replace(hour=0, minute=0, second=0, microsecond=0) + timedelta(hours=-2)) %}
{% set today_end = today + timedelta(days=1) %}
{% set today_bg = as_timestamp(today.strftime('%Y-%m-%d %H:%M:%S')) | timestamp_local%}
{% set today_ed = as_timestamp(today_end.strftime('%Y-%m-%d %H:%M:%S')) | timestamp_local%}
 {{ state_attr('sensor.weather_rest_data', 'timeseries')
   | rejectattr('time','lessthan',today_bg)
   | rejectattr('time','gt',today_ed)
   | map(attribute='data.next_1_hours.details.precipitation_amount')
   | map('float', 0)
   | sum
   | round(2)
 }}
I hope the explanation provided gives you enough insight to confidently debug this piece of code, should the need arise.
Step 5: Create Template Sensors for Daily Precipitation Summaries
At this point, you have two ready-to-use code snippets that calculate the total precipitation for the current and next day using forecast data.
To turn these into sensors in Home Assistant:
Navigate to Settings > Devices & Services > Helpers
Click “+ CREATE HELPER”
Select “Template”, then choose “Template sensor”
Give your sensor a meaningful Name
Paste your prepared Template code
Set:
Unit of measurement:
mmDevice class:
PrecipitationState class:
Measurement
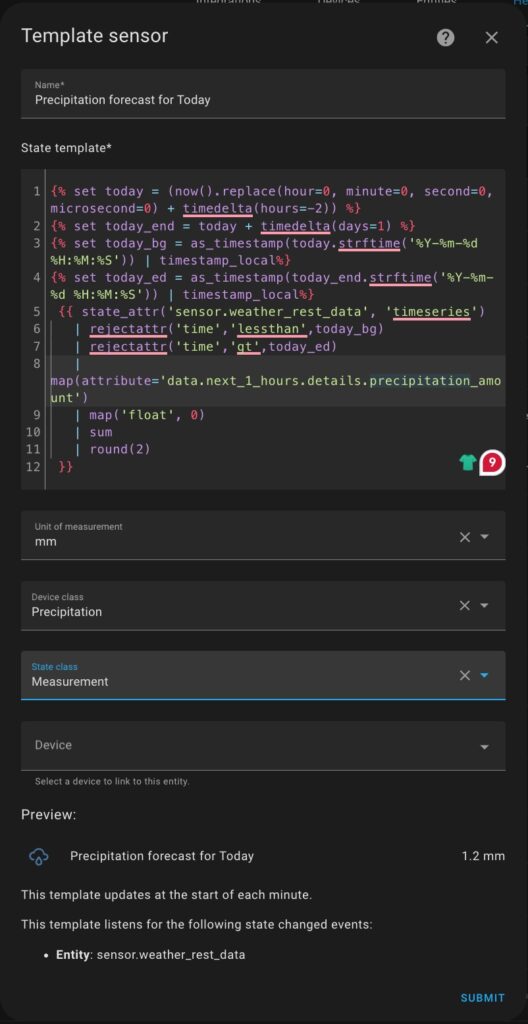
Save
Once you’ve entered all the details, click SUBMIT.
Your new Precipitation sensor will now appear under Helpers and can be used like any other sensor in Home Assistant.
🌧️ Conclusion
Now that you’ve created your precipitation sensor, you can use it to check the weather forecast before triggering your irrigation system — helping you save water and automate smarter decisions. For practical implementation, check out the related guide: Irrigation system controlled with Home Assistant .
And remember — this is just the beginning. The met.no API provides a wide range of weather data, from temperature and humidity to wind speed and UV index. You can extract and use any of these parameters to fine-tune your automations based on your local conditions and preferences.
Happy automating! 🌱💧