When it comes to improving indoor comfort, smart blinds or shutters are one of the most effective tools in a Home Assistant setup—especially when paired with solar irradiance data. While many popular services offer paid APIs for solar forecasting, there’s a surprisingly powerful and free alternative: the Forecast.Solar API.
In this article, we’ll explore how you can use Forecast.Solar to calculate solar irradiance and automate your blinds based on actual sunlight intensity—not just time of day or ambient brightness. This method provides a smarter, more dynamic approach that reacts to real-world conditions, helping you maintain a cozy atmosphere, reduce overheating, and even save on cooling costs—all without spending a dime on premium weather data.
Additionally, I’ve created the following video about that topic. So, feel free to watch it if it’s more preferable for you.
Forecast.Solar
Description
Forecast.Solar is a free and reliable service that provides photovoltaic production forecasts based on your location and panel setup. While Home Assistant has a default Forecast.Solar integration, it’s mainly focused on estimating energy production, not on giving you raw solar irradiance data.
To use irradiance values for smart automations—like adjusting blinds based on actual sunlight intensity—you need more granular control and access to specific parameters that aren’t exposed in the built-in integration. That’s where the RESTful API comes in.
By calling Forecast.Solar’s REST API directly, you can fetch watts per square meter, recalculate that parameter into the exact irradiance values, and use them to trigger smarter automations tailored to your comfort and energy-saving goals.
Data accuracy
Factors Affecting Forecast.Solar’s Accuracy
- Weather Forecast Accuracy:
- Cloud Cover: The largest source of error in solar irradiance forecasts is cloud cover prediction, as clouds significantly reduce irradiance (e.g., from 1000 W/m² clear-sky to 100–300 W/m² under overcast conditions).
- Source: Forecast.Solar relies on numerical weather prediction (NWP) models, which have varying accuracy:
- Short-Term (0–24 hours): High accuracy (70–90% for cloud cover), as models like GFS or ECMWF use recent satellite and ground observations.
- Long-Term (1–7 days): Accuracy decreases (50–70%), as weather patterns become less predictable.
- Impact for You: Your blind automation likely uses short-term forecasts (e.g., 15-minute to hourly updates), where cloud cover predictions are more reliable, improving irradiance estimates.
- Solar Radiation Modeling:
- PVGIS Integration: Forecast.Solar uses PVGIS’s historical and modeled irradiance data, which is highly accurate for Europe (including Poland) due to extensive satellite validation (e.g., Meteosat data).
- Clear-Sky Irradiance: Calculated using precise astronomical models (e.g., Ineichen-Perez or ESRA), accurate to within 2–5% for clear-sky conditions.
- Diffuse and Reflected Radiation: For vertical windows (90° tilt), diffuse (sky-scattered) and albedo (ground-reflected) radiation are significant. Forecast.Solar models these, but assumptions about local albedo (e.g., urban vs. rural surfaces) may introduce minor errors (5–10%).
- Spatial and Temporal Resolution:
- Spatial: Weather models typically have 10–25 km resolution, meaning local variations (e.g., microclimates in Warsaw) may not be captured.
- Temporal: Forecast.Solar provides 15-minute to hourly forecasts, sufficient for real-time blind control. However, rapid cloud changes (e.g., partly cloudy conditions) can cause short-term errors.
- Validation and Error Metrics:
- PVGIS Benchmark: PVGIS, a key data source, reports mean absolute errors (MAE) of ~5–10% for monthly irradiance and 10–20% for hourly forecasts in Europe, based on satellite validation.
- Forecast.Solar Claims: The API doesn’t publish specific accuracy metrics, but its reliance on PVGIS and NWP models suggests similar performance:
- Hourly MAE: ~10–20% for irradiance (e.g., ±30–60 W/m² at 300 W/m²).
- Daily MAE: ~5–10% for total energy (less relevant for real-time control).
- Community Feedback: Users on forums (e.g., Home Assistant, PV communities) report Forecast.Solar as “reliable” for short-term PV forecasting, with errors most noticeable during partly cloudy or rapidly changing weather.
- Impact for You: Errors of 10–20% are acceptable for blind automation.
Limitations and Sources of Error
- Forecast-Based: Forecast.Solar provides predictions, not real-time measurements. Real-time cloud cover changes (e.g., sudden clearing) can cause deviations.
- Local Conditions: Urban areas (e.g., Warsaw) may have localized shading, pollution, or albedo effects not fully modeled.
- Diffuse Radiation: Vertical windows rely on diffuse irradiance, which is harder to predict than direct irradiance (errors ~10–15%).
- Model Assumptions: If Forecast.Solar’s internal efficiency or loss assumptions differ from your 0.17, irradiance calculations may be off by 5–10%.
- No Real-Time Validation: Unlike Solcast (which uses live satellite data), Forecast.Solar relies on weather model forecasts, reducing accuracy during dynamic weather.
Comparison with Alternatives
Solcast:
- Accuracy: Higher for real-time and short-term forecasts (MAE ~5–15%), as it uses live satellite imagery (e.g., Himawari, GOES) and machine learning.
- Advantage: Direct W/m² output, no conversion needed. Better for rapidly changing weather.
- Drawback: Free tier requires approval; less accessible than Forecast.Solar’s public API.
- PVGIS:
- Accuracy: Excellent for historical/monthly data (MAE ~5–10%), but not designed for real-time or hourly forecasts.
- Drawback: No API for short-term forecasts, less relevant for automation.
- OpenWeather Solar Radiation API:
- Accuracy: Similar to Forecast.Solar (MAE ~10–20%), but often requires paid access for detailed irradiance data.
- Drawback: Less tailored for PV applications.
Solar Irradiance Calculate
Why re-calculation is needed
While Forecast.Solar is a fantastic tool for estimating solar power production, its built-in integration in Home Assistant is primarily tailored for photovoltaic energy systems. This means the data it exposes—such as estimated energy yield—is ideal for solar panel monitoring, but not well-suited for automation tasks that depend on real-time sunlight intensity, like controlling window blinds or HVAC systems. If you’re looking to improve indoor comfort by reacting to how sunny it is outside, you’ll quickly notice the limitation: irradiance values (measured in W/m²), which are critical for assessing sunlight strength, aren’t directly accessible through Forecast.Solar’s REST API. However, even then, the API doesn’t hand irradiance to us on a silver platter—it gives us values for energy production based on panel configuration (orientation, tilt, efficiency, etc.). To extract usable irradiance, we need to reverse-engineer the value by dividing the estimated energy output by panel efficiency and adjusting for known parameters. This calculation step transforms the API into a powerful tool for real-time solar-aware automation, giving us precise control to improve comfort, reduce glare, or optimize cooling—all without relying on expensive commercial irradiance APIs.
Step-by-Step Guide to Calculate Solar Irradiance
1. Understand Forecast.Solar API request paramenters
Please see the official documentation here.
- API Endpoint:
https://api.forecast.solar/estimate/<lat>/<lon>/<dec>/<azimuth>/<kWp>Let’s imagine your window is a south-facing photovoltaic panel with a tilt that matches your window angle (or wall, if vertical). When you send this configuration to Forecast.Solar, it returns predicted power output in watts for every hour (or in real-time). This hypothetical setup allows us to translate the forecasted energy production data into irradiance levels, giving us a practical and consistent way to evaluate sunlight intensity using the Forecast.Solar API.
The following parameter of your windows are needed:
:lat– latitude of location,-90(south) …90(north); handeled with a precission of 0.0001 or abt. 10 m:lon– longitude of location,-180(west) …180(east); handeled with a precission of 0.0001 or abt. 10 m:dec– plane declination,0(horizontal) …90(vertical) – always in relation to the earth’s surface; integer:az– plane azimuth,-180…180(-180 = north, -90 = east, 0 = south, 90 = west, 180 = north); integer:kwp– installed modules power inkilo watt; float
📌 Important Details to Consider
When configuring your solar irradiance calculations, it’s essential to adjust for real-world conditions. For example, the declination angle (dec) won’t be 90° if you’re calculating irradiance for roof windows, as they are typically tilted and not perpendicular to the ground. Adjust this value based on the actual tilt of your windows.
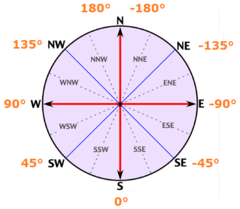
Additionally, be mindful of the azimuth (az) setting.
While a compass is a simple way to determine the direction your windows face, remember that most compasses use North (0°) as the reference point. However, Forecast.Solar API uses South as 0°, with East as -90° and West as 90°. So, a proper conversion is needed to avoid inaccurate calculations.
Formula: Aforecast = Acompass − 180
(if result > 180°, subtract 360°)
For example, I have windows in two directions: South East 166° and North East E76°, so API azimuths are:
- SE166: Aforecast = 166 − 180 = −14°
- NE76: Aforecast = 76 − 180 = −104°
Let’s take some random coordinates and calculate irradiance for two windows with the following API URLs:
https://api.forecast.solar/estimate/watts/52.2297/21.0122/90/-14/1https://api.forecast.solar/estimate/watts/52.2297/21.0122/90/-104/1As you can see (the last parameter in the URL), we defined our virtual photovoltaic panel with a nominal output of 1 kW. This value serves as the basis for the reverse calculation, allowing us to estimate the solar irradiance level based on the projected energy production from Forecast.Solar.
Output: JSON with watts – Watts (power) average for the period
- Example: {“watts”: {“2025-04-24T10:00:00+02:00”: 255}} (255 W at 10:00).
- There are other parameters in the JSON response, but we won’t use them:
- watt_hours_period – Watt hours (energy) for the period
- watt_hours – Watt hours (energy) summarized over the day
- watt_hours_day – Watt hours (energy) summarized for each day
📌 Important Details
If you try accessing those URLs directly in your browser, you’ll most likely see the response in CSV format. To view the data in JSON format, it’s best to use a tool like curl in your terminal or command line.
2. Define System Parameters for 1 kWp
- Peak Capacity: 1 kWp = 1000 W (under standard conditions: 1000 W/m² irradiance, 25°C, AM 1.5 spectrum).
- Panel Efficiency (η panel): Assume 20%, meaning the panel produces 200 W/m² at 1000 W/m² irradiance.
- Aria = Peak Capacity / Panel Efficiency = 1000W / 200 W/m² = 5m2
- System Efficiency (η):
- Panel efficiency: 0.20.
- System losses (inverter, wiring, etc.): 15%, so efficiency factor = 0.85.
- Total efficiency: η=0.20×0.85=0.17
3. Convert API Output to POA Irradiance
The Forecast.Solar API provides the instantaneous power output ( P ) (in watts) for a 1 kWp PV system with the specified tilt (90°) and azimuth (-14° or -104°). We need to convert this power to POA irradiance ( I ) (in W/m²) on the window’s surface.
Step 1: Understand the Relationship Between Power and Irradiance
The power output ( P ) of a PV system is proportional to the irradiance ( I ) hitting the panel (or window, in this case), the area of the panel, and the system’s efficiency:
P = I × Area × ηsystem
- ( P ): Power output (W), from the API (e.g., 255 W).
- ( I ): Plane-of-array irradiance (W/m²), what we want to calculate.
- Area: Effective area of the PV system (m²), calculated as 5 m² for a 1 kWp system at 20% efficiency.
- ηsystem: Total system efficiency (dimensionless), calculated as 0.17 (20% panel efficiency × 85% loss factor).
Step 2: Rearrange to Solve for Irradiance
- To find ( I ), rearrange the equation: I = P / (Area × ηsystem)
- Substitute the known values:
- Area=5 m²
- ηsystem=0.17
- I = P / (5×0.17) = P / 0.85
Step 3: Simplify the Conversion Factor
- Calculate the constant: 1 / 0.85 ≈ 1.176
So the formula becomes: I≈ P × 1.176
- Interpretation: For every watt of power output from the 1 kWp system, the irradiance on the window is approximately 1.176 W/m², accounting for the system’s area and efficiency.
- Why This Works:
- The API’s power output ( P ) is the result of the irradiance ( I ) on the window’s plane (90° tilt, -14° or -104° azimuth), reduced by the system’s efficiency and area.
- Dividing ( P ) by Area×ηsystem reverses this process, giving us the irradiance ( I ) that would produce that power on a 5 m² system with 17% efficiency.
Step 4: Assumptions and Adjustments
- Efficiency Assumptions: 20% panel efficiency and 15% losses (ηsystem = 0.17) are standard for PV systems. If Forecast.Solar uses different internal assumptions (e.g., 18% efficiency or 10% losses), the conversion factor may need adjustment.
- Tilt and Azimuth: The API accounts for the window’s orientation (90° tilt, -14°/-104° azimuth), so ( P ) already reflects the POA irradiance, not global horizontal irradiance (GHI).
Home Assistant Configuration
Step 1: Configure REST API sensor
Home Assistant’s RESTful Sensor integration allows us to fetch data from the API and parse it into a sensor. We’ll configure this in your configuration.yaml file.
For this purpose, make sure the “File Editor” add-on is installed.
If you’re unsure how to install it, refer to the chapter “Install ‘File Editor’ Plugin in Home Assistant” earlier in this article for step-by-step instructions.
Edit your configuration.yaml (or create a new file under sensors/ if using split configuration). Add the following REST sensor:
rest:
- resource: "https://api.forecast.solar/estimate/watts/52.2297/21.0122/90/-104/1"
method: GET
scan_interval: 1800 # Update every 30 min
timeout: 30
sensor:
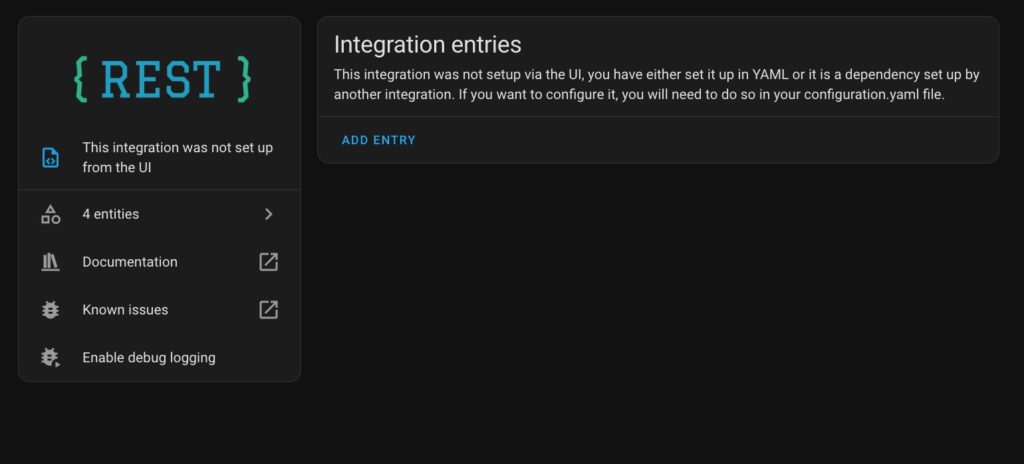
- name: Irradience_KidRoom_data
value_template: "{{ now().strftime('%Y-%m-%d %H:%M:%S') }}"
json_attributes:
- result
- message📌 Explanation
- resource: Specify the API URL for the Forecast.Solar service. If you have multiple rooms or windows with different azimuths, you will need to create a separate block for each, as the azimuth is defined in the URL.
- method: Choose the appropriate data retrieval method, either GET or POST, depending on how the API expects requests.
- scan Interval: Forecast.Solar imposes a limit of 12 public requests per hour for each instance. To comply with this, I’ve set up a request interval of 30 minutes, especially since I have two sensors with different azimuths. You can monitor whether the rate limit has been exceeded by checking the “ratelimit” section in the API response.
"ratelimit": {
    "zone": "IP YOUR_IP",
    "period": 3600,
    "limit": 12,
    "remaining": 5
}- timeout: This parameter prevents Home Assistant from waiting indefinitely for a response from the API. It’s essential to ensure that your system remains responsive, especially if there’s an issue with the API request.
- sensor:
- – name: unique name of your sensor
- value_template: A REST sensor must return a value, even if it stores the JSON data in its attributes. In this case, I use the timestamp of the last request as the sensor’s value. While it’s possible to write a template to calculate the irradiance value directly, this can add complexity and make debugging more difficult. To avoid this, I prefer to keep the JSON data intact for further calculations.
- json_attributes: API responses on the request used in the article with structure illustrated below. Therefore, “result” and “message” fields are taken in to the sensor from the API response.
{
    "result": {
        "2025-04-25 05:16:33": 0,
        "2025-04-25 06:00:00": 349,
        "2025-04-25 07:00:00": 709,
        "2025-04-25 08:00:00": 946,
        "2025-04-25 09:00:00": 986,
        "2025-04-25 10:00:00": 965,
        "2025-04-25 11:00:00": 856,
        "2025-04-25 12:00:00": 713,
        "2025-04-25 13:00:00": 647,
        "2025-04-25 14:00:00": 607,
        "2025-04-25 15:00:00": 533,
        "2025-04-25 16:00:00": 434,
        "2025-04-25 17:00:00": 322,
        "2025-04-25 18:00:00": 192,
        "2025-04-25 19:00:00": 100,
        "2025-04-25 19:51:13": 0,
        "2025-04-26 05:14:30": 0,
        "2025-04-26 06:00:00": 1703,
        "2025-04-26 07:00:00": 3402,
        "2025-04-26 08:00:00": 4283,
        "2025-04-26 09:00:00": 4068,
        "2025-04-26 10:00:00": 2974,
        "2025-04-26 11:00:00": 1869,
        "2025-04-26 12:00:00": 1048,
        "2025-04-26 13:00:00": 727,
        "2025-04-26 14:00:00": 671,
        "2025-04-26 15:00:00": 592,
        "2025-04-26 16:00:00": 486,
        "2025-04-26 17:00:00": 365,
        "2025-04-26 18:00:00": 221,
        "2025-04-26 19:00:00": 116,
        "2025-04-26 19:52:56": 0
    },
    "message": {
        "code": 0,
        "type": "success",
        "text": "",
        "pid": "H0T544e5",
        "info": {
            "latitude": 52.2297,
            "longitude": 21.0122,
            "distance": 0.004,
            "place": "Rondo Romana Dmowskiego, 00-693 Warsaw, Poland",
            "timezone": "Europe/Warsaw",
            "time": "2025-04-25T10:21:39+02:00",
            "time_utc": "2025-04-25T08:21:39+00:00"
        },
        "ratelimit": {
            "zone": "IP YOUR_IP",
            "period": 3600,
            "limit": 12,
            "remaining": 4
        }
    }
}
💾 Save and Restart Required
Don’t forget to save your
configuration.yamlfile after making changes. If you’re adding your first REST sensor, simply reloading YAML from the Developer Tools won’t be sufficient. In this case, you need to restart Home Assistant Core from the Settings > System > Restart menu to properly apply the changes.
Step 2: CHECK YOUR CONFIGURATION
🔍 Verify REST Integration
First, ensure that the REST integration has been successfully recognized by Home Assistant. You can check this by navigating to Settings > System > Devices & Services. If the integration appears there, your configuration has been loaded correctly.
🔍 Inspect REST Entities
Next, click on your newly created REST entities. Ensure that they are returning valid values. If the values are empty or show errors, double-check your configuration and the data structure of the API response.
Expand the Atrributes section of your new sensor to see stored JSON from the response.
Step 3: Write Template code for Current Irradiation level
The Template Editor in Home Assistant is an excellent tool for creating sensors and debugging template code effectively.
Open Developer Tools > Template.
Paste the following code:
{% set curtime = (now().replace(minute=0, second=0, microsecond=0)) %}
{% set nowstr = curtime .strftime('%Y-%m-%d %H:%M:%S') | string %}
{{nowstr}}
{%set watts = state_attr('sensor.irradience_kidroom_data', 'result')  %}
{{ ((watts[nowstr] if nowstr in watts else 0 |int) * 1.176) | round(2) }}
📌 Important notes and explanation:
- irradience_kidroom_data – replace this with your sensor name from the previous step.
- As a result, you should see something like this in the “Result panel”:
2025-04-25 13:00:00

129.36
The first row displays the output of {{ nowstr }} (added to illustrate how to view intermediate variables), while the second row shows the calculated irradiance value.
- row 4: extraction array data from “result” JSON field.
- row 5: extraction value of estimated watts for current hour and multiplying it by 1.176 coefficient from “Step 3: Simplify the Conversion Factor” chapter above for calculating irradiance value.
- Some debug is needed if you got any errors in the “Result panel”.
Step 4: Create Template Sensors for Current Irradiation level
At this point, you have two ready-to-use code snippets for template sensor creation.
To turn these into sensors in Home Assistant:
Navigate to Settings > Devices & Services > Helpers
Click “+ CREATE HELPER”
Select “Template”, then choose “Template sensor”
Give your sensor a meaningful Name
Paste your prepared Template code, don’t forget to remove all intermediate outputs for debugging purposes like {{ nowstr }}.
Set:
Unit of measurement: W/m²
Device class:
IrradienceState class:
Measurement
- You should see a value of your new sensor in the Preview section as on illustration below:
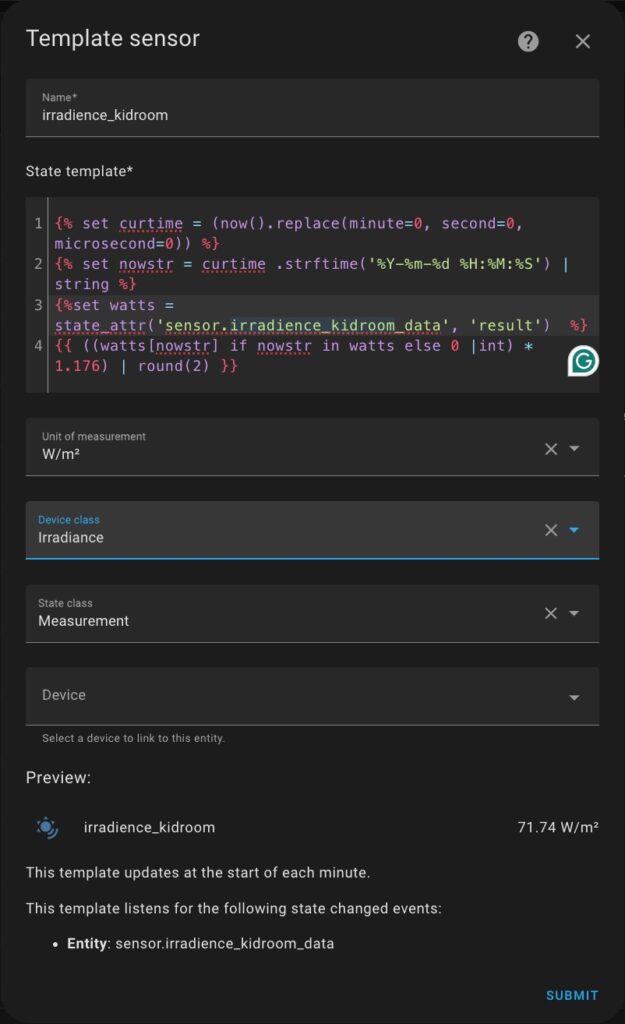
Save
Once you’ve entered all the details, click SUBMIT.
Your new Precipitation sensor will now appear under Helpers and can be used like any other sensor in Home Assistant.
Step 5: Take a Break and Observe the Irradiances for your windows
Before moving forward, I highly recommend taking a couple of days to observe how your solar irradiance sensor setup is performing.
Start by estimating the appropriate irradiance thresholds for when your blinds should open or close. Instead of immediately automating the blinds, create a simple automation that sends you notifications when these thresholds are reached. This gives you a chance to compare the actual room conditions with the predicted values and fine-tune the thresholds accordingly.
This approach helps you avoid unexpected or unnecessary blind movements, keeping your family happy while you dial in the ideal comfort settings.Please see this guide about Universal script for Home Assistant notifications to setup notifications.
Otherwise, you can add your irradiance sensor to your dashboard and check the irradiance levels.
Conclusion
Now that you’ve created your own solar irradiance sensor, you’re equipped to take a smart step toward improving home comfort and reducing your reliance on air conditioning—simply by automating your window blinds or shutters based on real-time sunlight intensity. It’s also worth highlighting a useful side effect of this approach. While it may seem like we’ve added complexity by reversing irradiance from estimated photovoltaic power, we’ve actually saved time in another area. The Forecast.Solar API already takes into account the azimuth and tilt (declination) of your windows, sparing you from performing those complex geometric calculations yourself. In the end, it’s a clever trade-off that offers both flexibility and precision.
Happy automating!