When reporting internet connectivity issues, ISP support often defaults to blaming the user’s hardware. Proving that the fault lies on the ISP’s side is challenging, particularly with streaming performance issues. To build a solid case, it’s essential to gather evidence by tracing the network path and identifying which specific hop is responsible for the latency.
For this type of diagnostics, MTR is the superior utility. This guide provides step-by-step instructions on how to add MTR data to your Home Assistant dashboard, giving you real-time visibility into your ISP’s performance.
Why Monitor with TCP-based MTR?
If you’ve ever struggled to prove to your ISP that your connection is lagging, this guide is for you. Here is the high-level breakdown of the solution:
The Gap: Home Assistant lacks native tools for deep network path analysis.
The Solution: A custom script that uses MTR (My Traceroute) with TCP probes to simulate real-world streaming traffic to YouTube.
The Integration: Data is pushed directly to Home Assistant via a Webhook Sensor for real-time dashboard visualization.
Why TCP? Unlike standard ICMP (ping), TCP probes reveal hidden congestion and jitter that actually affect your browsing and streaming.
Expert Tip: This script focuses on the final three hops of the path. By monitoring the “Last Mile” to the service provider (like YouTube/Google), you filter out local noise and see exactly how the destination server is receiving your data, even if your ISP’s firewall drops monitoring packets for any reason.
- The Universal Approach: This solution is specifically designed to work across all Home Assistant versions. Because the script pushes data via Webhooks, it is the perfect workaround for HAOS (Home Assistant OS) users who cannot easily install custom binaries, but can run a script on another instanse in their home lab. HA Docker setup users can run that script on the same host as HA.
Create the Script
First of all, install the necessary tools:
sudo apt-get update && sudo apt-get install mtr bc jq curl -y
| Tool | Purpose in your Script |
mtr | Performs the actual TCP-based traceroute to redirector.googlevideo.com. |
bc | Handles the mathematical comparisons (floating-point math) for thresholds (e.g., checking if $window_max_lat > $LATENCY_THRESHOLD). |
jq | Processes and formats the complex JSON payload before sending it to Home Assistant. |
curl | Performs the POST request to the Home Assistant API/Webhook. |
Next, create the file and make it excecutable:
sudo touch /opt/host_availability.sh
sudo chmod +x /opt/host_availability.sh
Open it in your preferred text editor e.g. mcedit, and add the following script:
#!/usr/bin/env bash

# Requirements: sudo apt install mtr bc jq -y
TOKEN="YOUR_HA_TOKEN"


# --- CONFIGURATION ---
TARGET="redirector.googlevideo.com"
PORT=443
CYCLES=5
INTERVAL=1
TIMEOUT=2
CHECK_WINDOW=3      # Only look at the last 3 visible hops
LOSS_THRESHOLD=25   # Alert if loss in window > 25%
LATENCY_THRESHOLD=150
SD_THRESHOLD=100

export LC_NUMERIC=C

HA_URL="YOUR_HA_URL" # Ensure port is correct for your setup

# --- SCRIPT START ---
timestamp() {
    date -u +"%Y-%m-%dT%H:%M:%SZ"
}

# Run mtr with wide report to ensure columns don't truncate
mtr_output=$(mtr --report --report-cycles="$CYCLES" --tcp --port="$PORT" --no-dns --report-wide --timeout=$TIMEOUT --interval="$INTERVAL" "$TARGET" 2>&1)

if [[ $? -ne 0 ]]; then
    echo "Error running mtr: $mtr_output" >&2
    exit 1
fi

max_loss=0
worst_hop=""
worst_avg_latency=0
hops_json="["

# 1. Parse full MTR report into JSON including StDev
while IFS= read -r line; do
    # This regex captures Hop, Host, Loss, Sent, Avg, and StDev
    if [[ "$line" =~ ^[[:space:]]*([0-9]+)\.\|--[[:space:]]+([^[:space:]]+)[[:space:]]+([0-9.]+)%[[:space:]]+([0-9]+)[[:space:]]+[0-9.]+[[:space:]]+([0-9.]+)[[:space:]]+[0-9.]+[[:space:]]+([0-9.]+)[[:space:]]+([0-9.]+) ]]; then
        hop_num="${BASH_REMATCH[1]}"
        host="${BASH_REMATCH[2]}"
        loss="${BASH_REMATCH[3]}"
        sent="${BASH_REMATCH[4]}"
        avg="${BASH_REMATCH[5]}"
        worst="${BASH_REMATCH[6]}"
        stdev="${BASH_REMATCH[7]}"

        # Append to JSON string
        hops_json+=$(printf '{"hop":%d,"host":"%s","loss_percent":%.1f,"sent":%d,"avg_ms":%.1f,"worst_ms":%.1f,"stdev":%.1f},' \
            "$hop_num" "$host" "$loss" "$sent" "$avg" "$worst" "$stdev")

        # Track absolute worsts for internal debugging
        if (( $(echo "$loss > $max_loss" | bc -l) )); then
            max_loss="$loss"
            worst_hop="$hop_num ($host)"
            worst_avg_latency=$(printf "%.1f" "$avg")
        fi
    fi
done <<< "$mtr_output"

# Remove trailing comma and close array
hops_json="${hops_json%,}]"

# --- 2. Extract specific Window for On/Off Logic ---
recent_hops=$(echo "$mtr_output" | grep "|--" | grep -v "???" | tail -n "$CHECK_WINDOW")

# Extract Window Loss
window_max_loss=$(echo "$recent_hops" | tr -d '%' | awk '{print $3}' | sort -rn | head -n 1)
# Extract Window Latency (Avg)
window_max_lat=$(echo "$recent_hops" | awk '{print $6}' | sort -rn | head -n 1)
# Extract Window Jitter (StDev)
window_max_sd=$(echo "$recent_hops" | awk '{print $9}' | sort -rn | head -n 1)

# SAFETY: If any value is not a valid number, force it to 0
[[ ! "$window_max_loss" =~ ^[0-9.]+$ ]] && window_max_loss=0
[[ ! "$window_max_lat" =~ ^[0-9.]+$ ]] && window_max_lat=0
[[ ! "$window_max_sd" =~ ^[0-9.]+$ ]] && window_max_sd=0

# --- 3. Final Status Determination ---

# Check if BOTH thresholds are exceeded at the same time

if (( $(echo "$window_max_lat > $LATENCY_THRESHOLD" | bc -l) )) && (( $(echo "$window_max_loss > $LOSS_THRESHOLD" | bc -l) )); then
    status="on"
    friendly="Network Crisis: High Latency (${window_max_lat}ms) AND High Loss (${window_max_loss}%) detected."

# Optional: Keep individual checks as warnings or turn status "off" for them
elif (( $(echo "$window_max_sd > $SD_THRESHOLD" | bc -l) )); then
    status="on"
    friendly="High Jitter: ${window_max_sd}ms at destination."

else
    status="off"
    friendly="Stable: ${window_max_lat}ms (SD: ${window_max_sd}ms)"
fi


# 4. Create the data payload
# We pass the windowed (cleaned) metrics to HA's main attributes
api_payload=$(jq -n \
  --arg state "$status" \
  --arg ts "$(timestamp)" \
  --arg tar "$TARGET" \
  --argjson port "$PORT" \
  --arg friend "$friendly" \
  --argjson loss "$window_max_loss" \
  --arg worst "$worst_hop" \
  --argjson lat "$window_max_lat" \
  --argjson sd "$window_max_sd" \
  --argjson hops "$hops_json" \
  '{
    state: $state,
    attributes: {
      timestamp: $ts,
      target: $tar,
      port: $port,
      status: $state,
      friendly: $friend,
      window_loss: $loss,
      worst_hop: $worst,
      window_latency_avg: $lat,
      window_jitter_sd: $sd,
      hops: $hops
    }
  }')

# 5. Push to Home Assistant
curl -X POST \
     -H "Authorization: Bearer $TOKEN" \
     -H "Content-Type: application/json" \
     -d "$api_payload" \
     "$HA_URL/api/states/sensor.mtr_availability"
⚠️ Explanation:
1. Target and Connection Settings
These define where the script looks and how it connects.
TARGET: Set toredirector.googlevideo.com. This is the endpoint YouTube uses to balance traffic. Monitoring this gives you the best representation of “streaming health.”PORT: Set to443. This ensures the script uses HTTPS traffic (TCP), simulating an actual browser or app request.CYCLES: The number of probes sent to each hop. A higher number (e.g.,10) gives more accurate averages but makes the script run longer; additionally, a higher number can trigger security rules on firewalls to start dropping your packets.INTERVAL&TIMEOUT: Controls the speed of the probes.1second is standard for a balance between speed and reliability.
2. The “Window” Logic (Sensitivity)
This is the “brain” of your script that prevents false alarms.
CHECK_WINDOW: Set to3. This tells the script to only evaluate the last three visible hops before the destination. This is your “Last Mile” strategy—ignoring local fluctuations to focus on the service’s entry point.LOSS_THRESHOLD: Currently set twice (see note below). This is the percentage of packet loss that triggers a “Network Crisis” state.
3. Thresholds (The Alarm Triggers)
These variables determine when the Home Assistant sensor flips from OFF for “Stable” to ON for “Crisis” or “High Jitter.”
LATENCY_THRESHOLD: Set to150. If the average round-trip time exceeds 150ms, the script flags it.LOSS_THRESHOLD: Set to25. This is the final gate for the “On” status.SD_THRESHOLD: Set to100. This monitors “Standard Deviation” (Jitter). High jitter means the connection is unstable, even if the speed is fast.
4. Home Assistant Integration
TOKEN: Your Long-Lived Access Token. This is your “key” to talk to the HA API.HA_URL: The address of your Home Assistant instance.Example:
http://192.168.1.100:8123orhttps://yourdomain.ui:your_external_port.
Home Assistant Configuration
Generate Long-lived access token
First of all, you need a Long-lived access token for your script:
- Click to your HA username with foto in the bottom-left corner of your HA web-UI.
- Switch to “Security” tab, scroll down, and click “Create tocken”.
- Name your new token and copy it to the TOKEN variable in your script.
Now, run your script, and check if a new entity is appeared in your HA:
- Navigate to Settings → Developer Tools, and switch to the States tab.
- Type “mtr” in “Filter entities” field, and check a new entity:
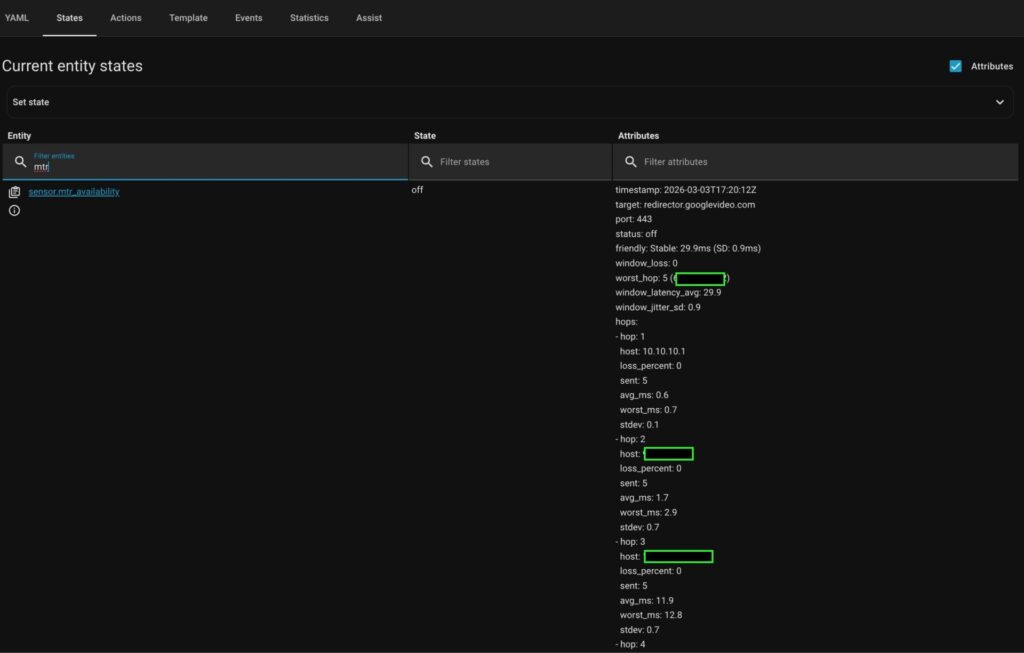
⚠️ Explanation:
As you can see, the entity has two states ON if a connection issue is detected, and OFF if no issues are detected.
It’s very useful to set up an automation for sending notifications.
HA Dashboard set up
The added sensor isn’t convenient for use with standard dashboard cards.
Hopefully, flex-table-card is available in HACS integration.
So, install that card with flex and add it to your dashboard.
That card can be configured with yaml editor only. Therefore, insert the following code:
type: custom:flex-table-card
title: Network Diagnostics
entities:
- sensor.mtr_availability
columns:
- name: Hop
data: hops
modify: x.hop
- name: Host
data: hops
modify: x.host
- name: Loss
data: hops
modify: x.loss_percent
suffix: "%"
- name: Latency
data: hops
modify: x.avg_ms
suffix: " ms"
- name: STDEV
data: hops
modify: x.stdev
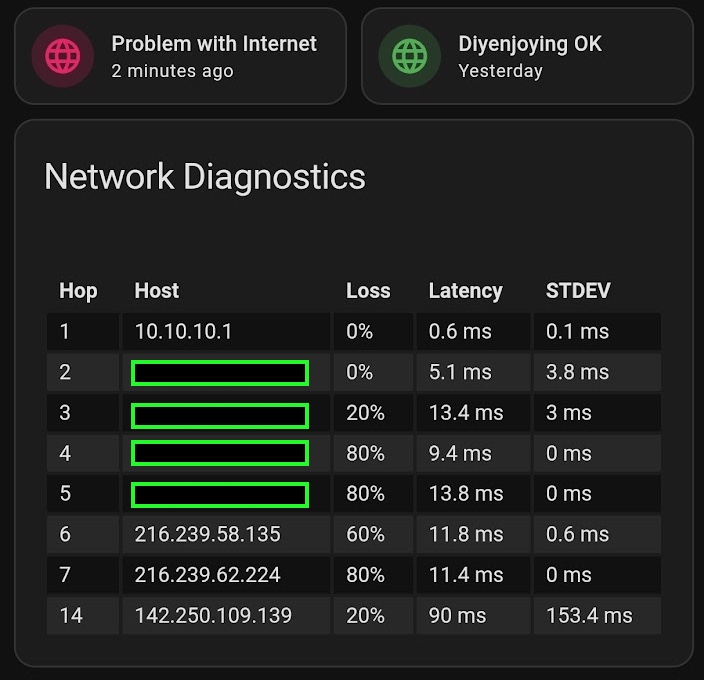
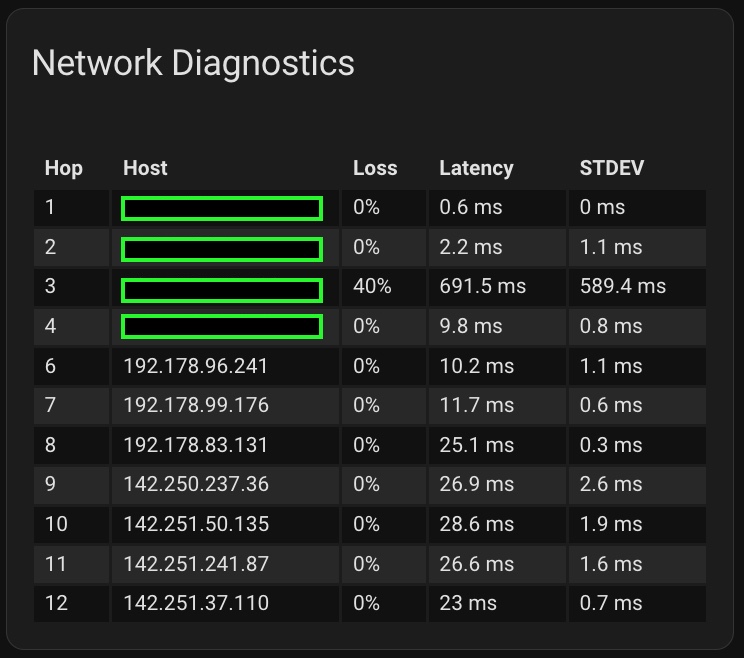
suffix: " ms"As a result, you should see a card like below, depending on your current style:
Telegram Notification
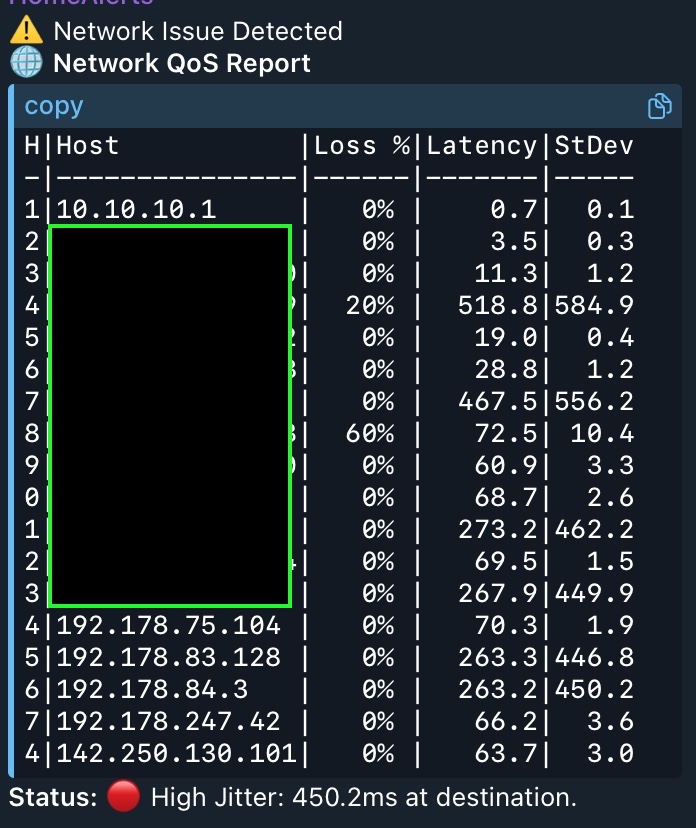
Additionally, you can use the following yaml code for sending detailed notifications in Telegram:
action: telegram_bot.send_message
data:
  target: YOUR_BOT_ID
  title: ⚠️ Network Issue Detected
  parse_mode: html
  message: >
    <b>🌐 Network QoS Report</b>

    <pre>

    H|Host           |Loss %|Latency|StDev

    -|---------------|------|-------|-----

    {% for h in state_attr('sensor.mtr_availability', 'hops') -%}

    {{ "%1s|%-15.15s| %3d%% |%7.1f|%5.1f" | format(h.hop|string|last, h.host,
    h.loss_percent|int, h.avg_ms|float, h.stdev|float) }}

    {% endfor %}

    </pre>

    <b>Status:</b> {{ "🟢" if is_state('sensor.mtr_availability', 'off') else
    "🔴" }} {{ state_attr('sensor.mtr_availability', 'friendly') }}
⚠️ Explanation:
Don’t forget to replace YOUR_BOT_ID with your actual Telegram bot ID.
Running Script by Scchedule
The last step is configuring cron to run the script by schedule.
Let’s create a cron file and set up the right permissions:
sudo touch /etc/cron.d/mtr_monitor
sudo chmod 0644 /etc/cron.d/mtr_monitor
Open it in your preferred text editor e.g. mcedit, and add the following config:
# Example of job definition:
# .---------------- minute (0 - 59)
# |  .------------- hour (0 - 23)
# |  |  .---------- day of month (1 - 31)
# |  |  |  .------- month (1 - 12) OR jan,feb,mar,apr ...
# |  |  |  |  .---- day of week (0 - 6) (Sunday=0 or 7) OR sun,mon,tue,wed,thu,fri,sat
# |  |  |  |  |
# *  *  *  *  * user-name command to be executed

*/5 * * * * root /opt/host_availability.sh
⚠️ Tips:
- Adjust scheduling according to your preferences.
- The last EMPTY row is MANDATORY, otherwise cron daemon won’t apply your config.
Restart cron daemon to apply the config:
sudo systemctl restart cronNow you have your Internet health monitoring sensor working!!!